Issues triggers & alerts
Issue overview
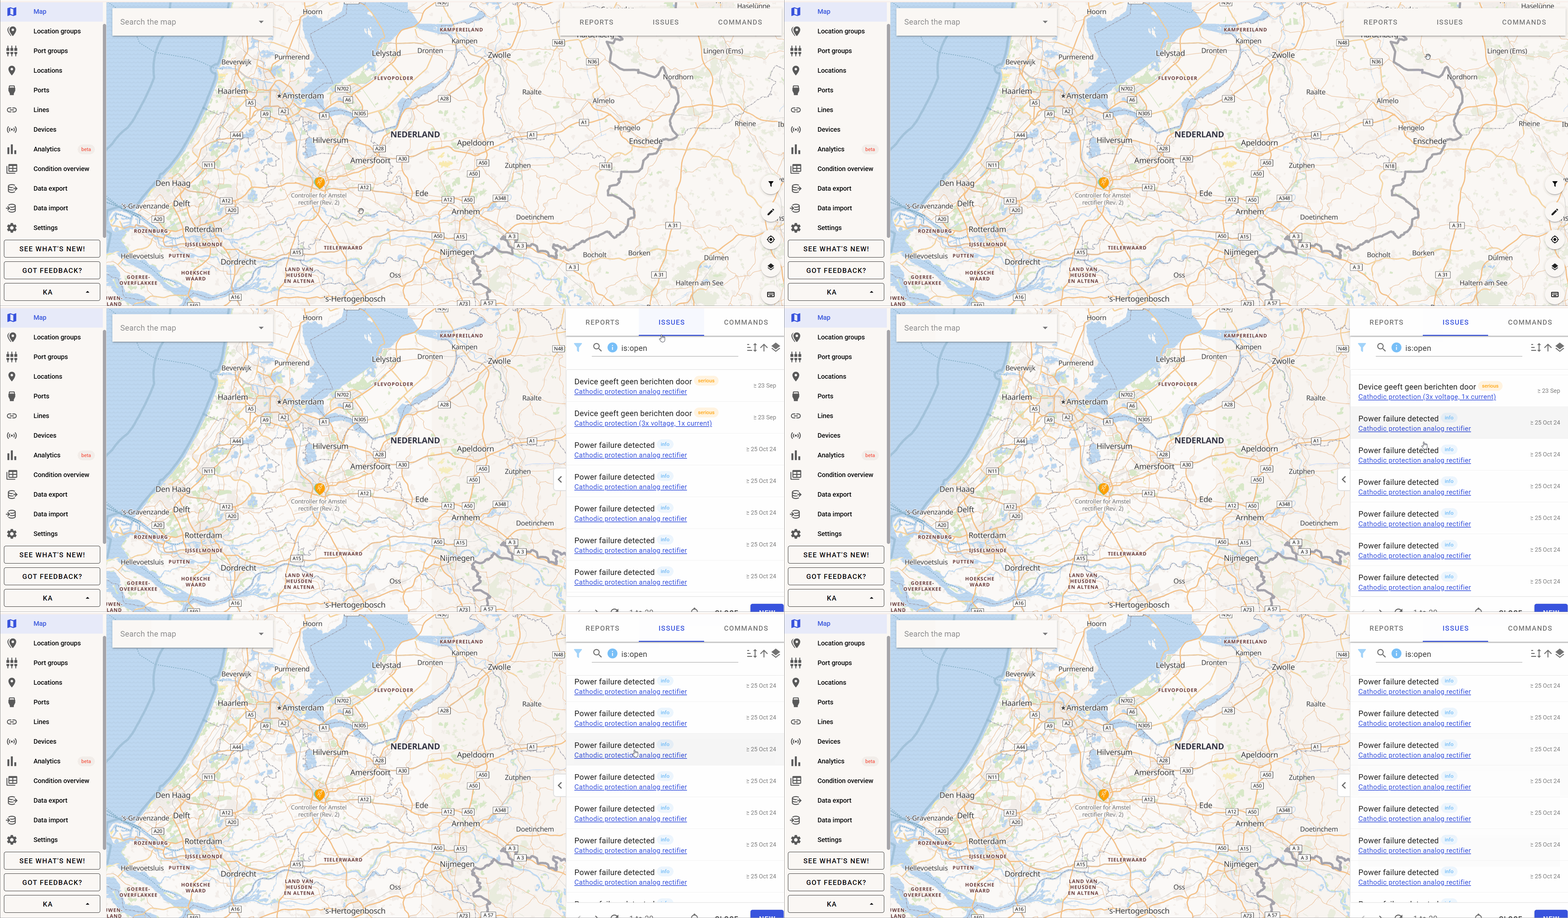
Issues are what it’s all about in the Withthegrid platform. As long as there are no issues nothing needs your attention. The overview of issues is always visible on the right hand side of the screen. This shows the locations where something unexpected has occurred.
Setting issue triggers
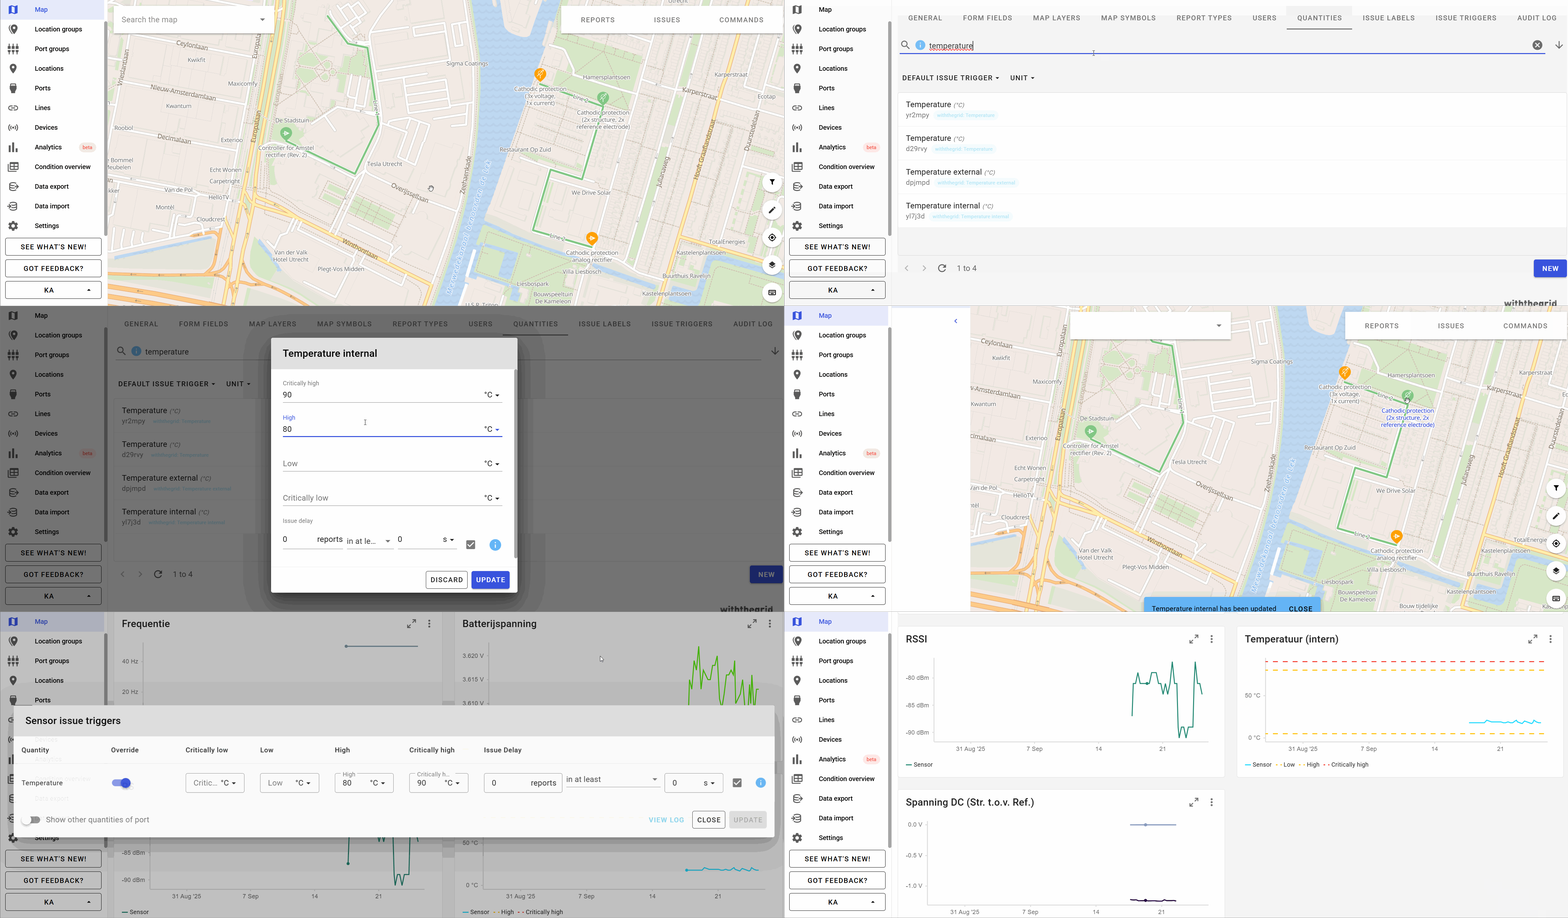
Issues can be triggered automatically by setting issue triggers. Issue triggers are defined by setting thresholds on the measurement values coming in. There are 3 urgency levels of issues:
Critical (red)Serious (orange)Info (blue)
When setting thresholds there can be an upper bound level and a lower bound level. This creates 4 possible thresholds that can be crossed. The info severity level can only be added manually.
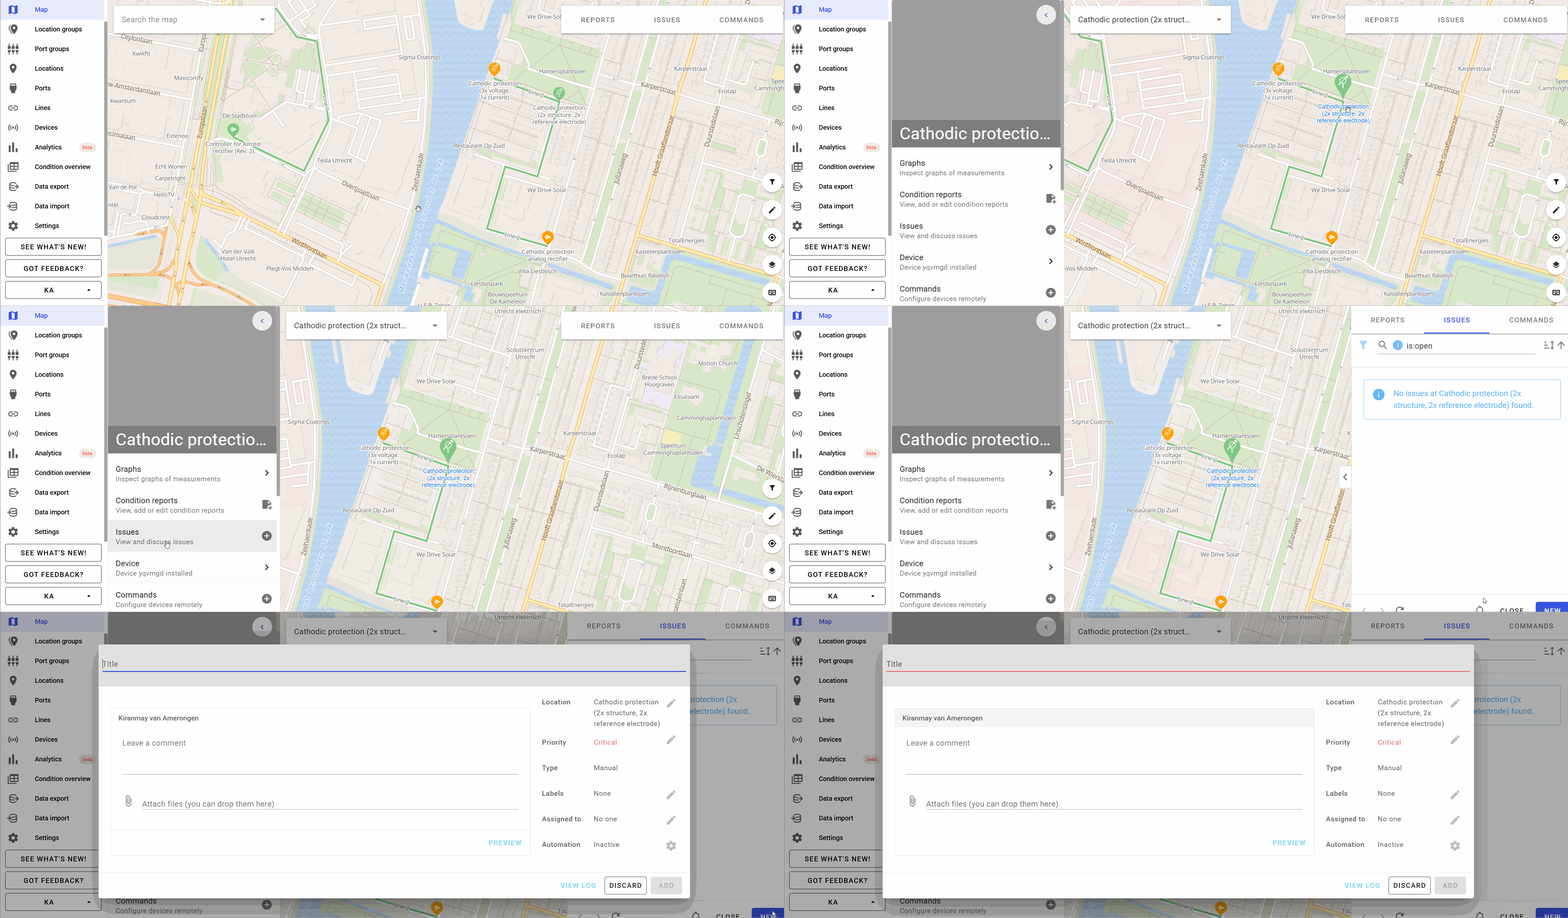
It is also possible to manually add an issue.
Issue delay
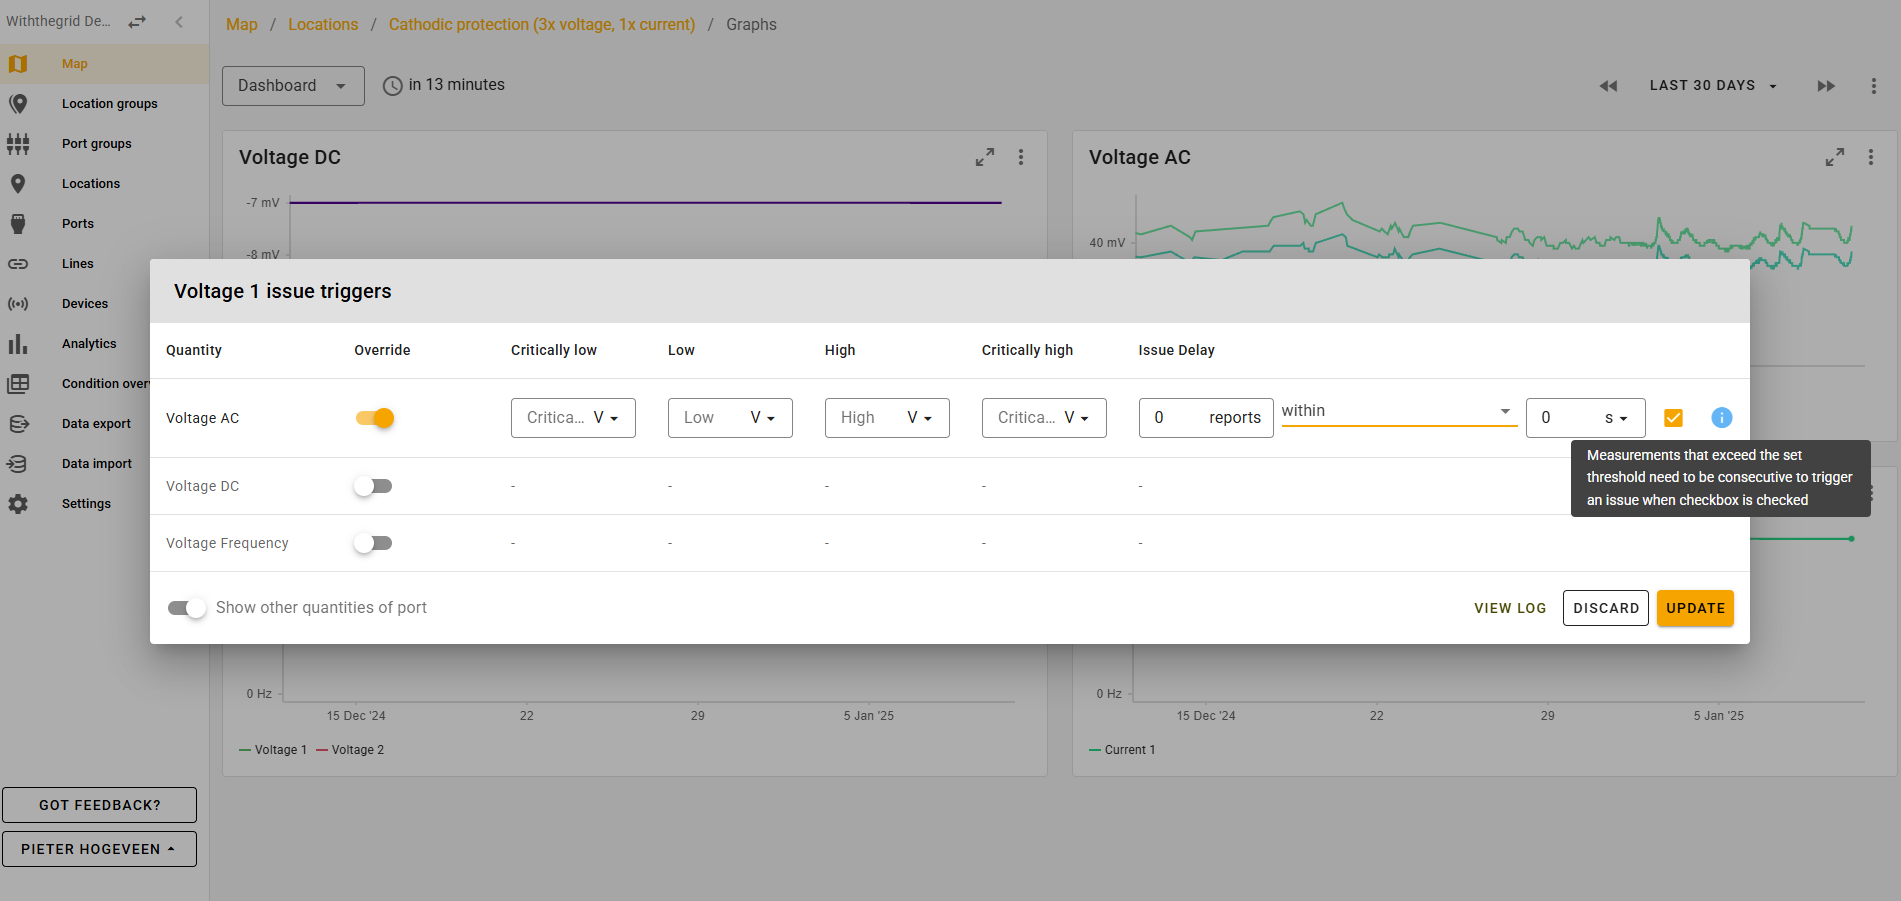
The Issue Delay feature allows users to control when new issues are created. This helps reduce the amount of newly created issues. Delays can be edited in the Issue Triggers section of the Settings menu.
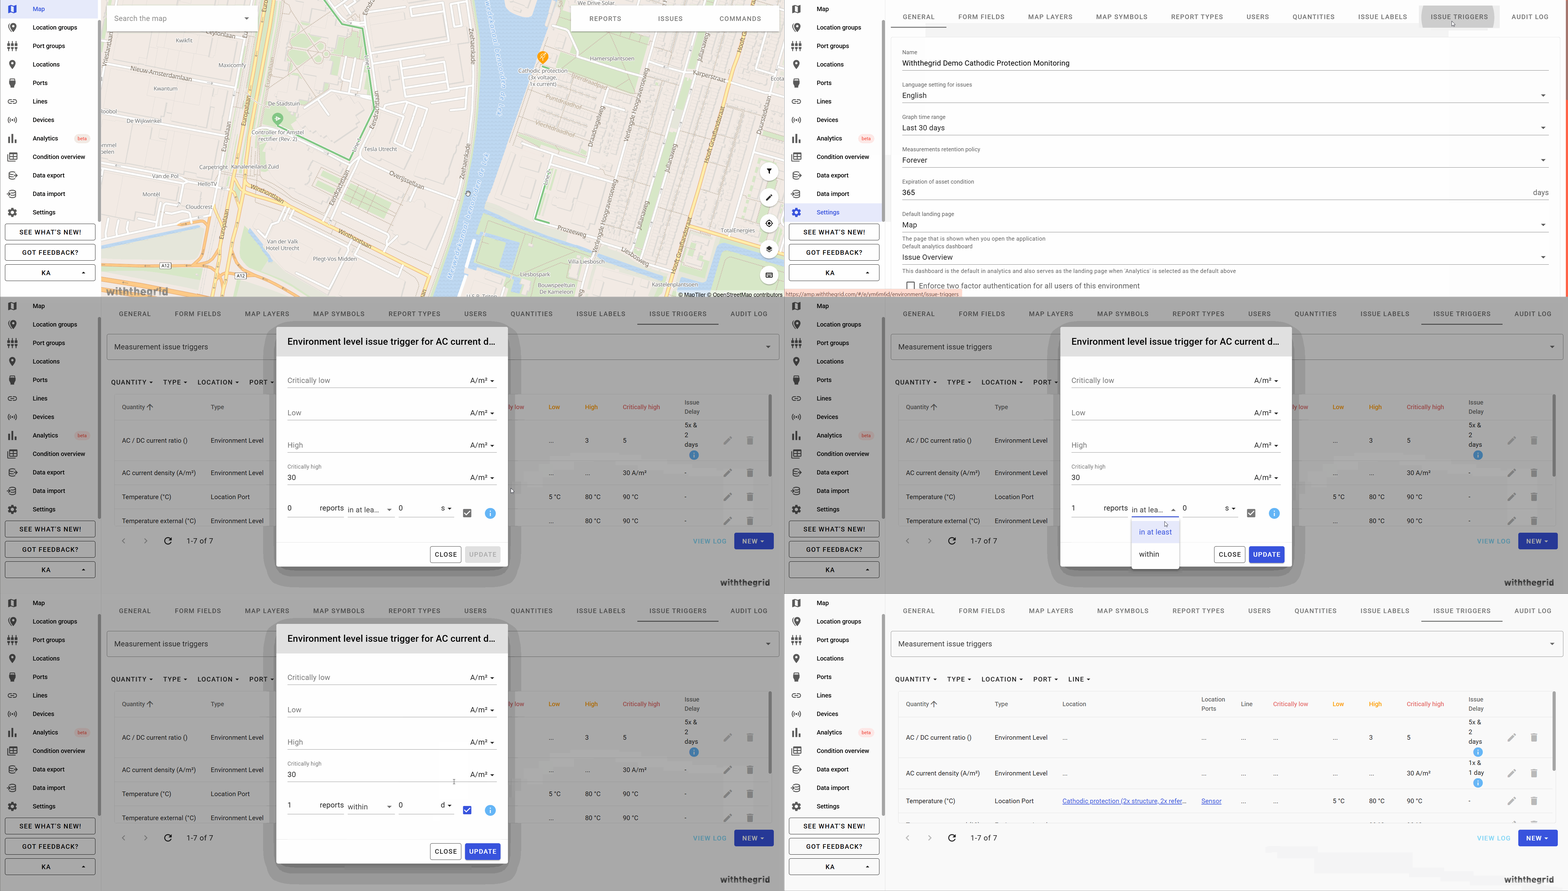

Consequently, in the bottom row you can set;
1. the number of reports with threshold violating measurements
2. the period of time the reports with with threshold violating measurements are coming in.
3. whether the period of time should be considered as the period it endures ‘at least’
or the period of time ‘within’ the reports with threshold violating measurements should come in.
4. Whether you want the number of threshold violating measurements to be in consecutive reports or not. Consecutive means that there are x measurements one after another, and not interrupted by better measurements. (eg: critical critical good critical is a sequence of 3 non-consecutive critical measurements). A report with a ‘non threshold violating measurement’ sets the counter for both reports and time back to zero.This is only possible to change when the period of time is set for ‘within’. For ‘at least’ it is set at ‘consecutive’ by default.
For clarification consider the following scenarios of ‘within’ + consecutive on/off
SCENARIO 1:
threshold value is 5
trigger is 3x within 2h, consecutive enabled
device measures every 30 minutes
measurements are:
4 at 09:30 -> good m - not triggered
6 at 10:00 -> bad m - not triggered
6 at 10:30 -> bad m - not triggered
6 at 11:00 -> bad m - triggered (There are 3 consecutive bad measurements in an interval of 2hours)
SCENARIO 2:
threshold value is 5
trigger is 3x within 2h, consecutive enabled
device measures every 30 minutes
measurements are:
4 at 09:30 -> good m - not triggered
6 at 10:00 -> bad m - not triggered
6 at 10:30 -> bad m - not triggered
4 at 11:00 -> good m - not triggered
6 at 11:30 -> bad m - not triggered (There are 3 bad measurements in an interval of 2hours, but they are not consecutive)
SCENARIO 3:
threshold value is 5
trigger is 3x within 2h, consecutive disabled
device measures every 30 minutes
measurements are:
4 at 09:30 -> good m - not triggered
6 at 10:00 -> bad m - not triggered
6 at 10:30 -> bad m - not triggered
6 at 11:00 -> bad m - triggered (There are 3 bad measurements in an interval of 2hours)
SCENARIO 4:
threshold value is 5
trigger is 3x within 2h, consecutive disabled
device measures every 30 minutes
measurements are:
4 at 09:30 -> good m - not triggered
6 at 10:00 -> bad m - not triggered
6 at 10:30 -> bad m - not triggered
4 at 11:00 -> good m - not triggered
6 at 11:30 -> bad m - triggered (There are 3 bad measurements in an interval of 2hours, they are not consecutive but this is not required)
For clarification consider the following scenarios of ‘at least’ + consecutive on (by default)
SCENARIO 1:
threshold value is 5
trigger is 3x & 2h
device measures every 30 minutes
measurements are:
4 at 09:30 -> not triggered
6 at 10:00 -> not triggered
6 at 10:30 -> not triggered
7 at 11:00 -> not triggered (it is three times but not 2h)
6 at 11:30 -> not triggered (it is three times but not 2h)
6 at 12:00 -> triggered (there are three or more consecutive threshold passing measurements and there is no non threshold passing measurement in the last 2 hours)
SCENARIO 2:
threshold value is 5
trigger is 3x & 2h
device measures every 24 hours
measurements are:
6 at 09:00 22-04-22 -> not triggered
6 at 09:00 23-04-22 -> not triggered
6 at 09:00 24-04-22 -> triggered (there are three or more consecutive threshold passing measurements and there is no non threshold passing measurement in the last 2 hours)
SCENARIO 3:
threshold value is 5
trigger is 3x & 2h
device measures every 24 hours
measurements are:
4 at 09:00 22-04-22 -> not triggered
6 at 09:00 23-04-22 -> triggered (there are one or more consecutive threshold passing measurements and there is no non threshold passing measurement in the last 2 hours)
Individual issue delay
It is also possible to set an Issue Delay for an individual quantities on a port. Just click the three bullets button on the top right of the graph, select ‘Edit issue triggers’. Toggle the quantities you want to override with an Issue Delay.
Filtering and sorting issue triggers
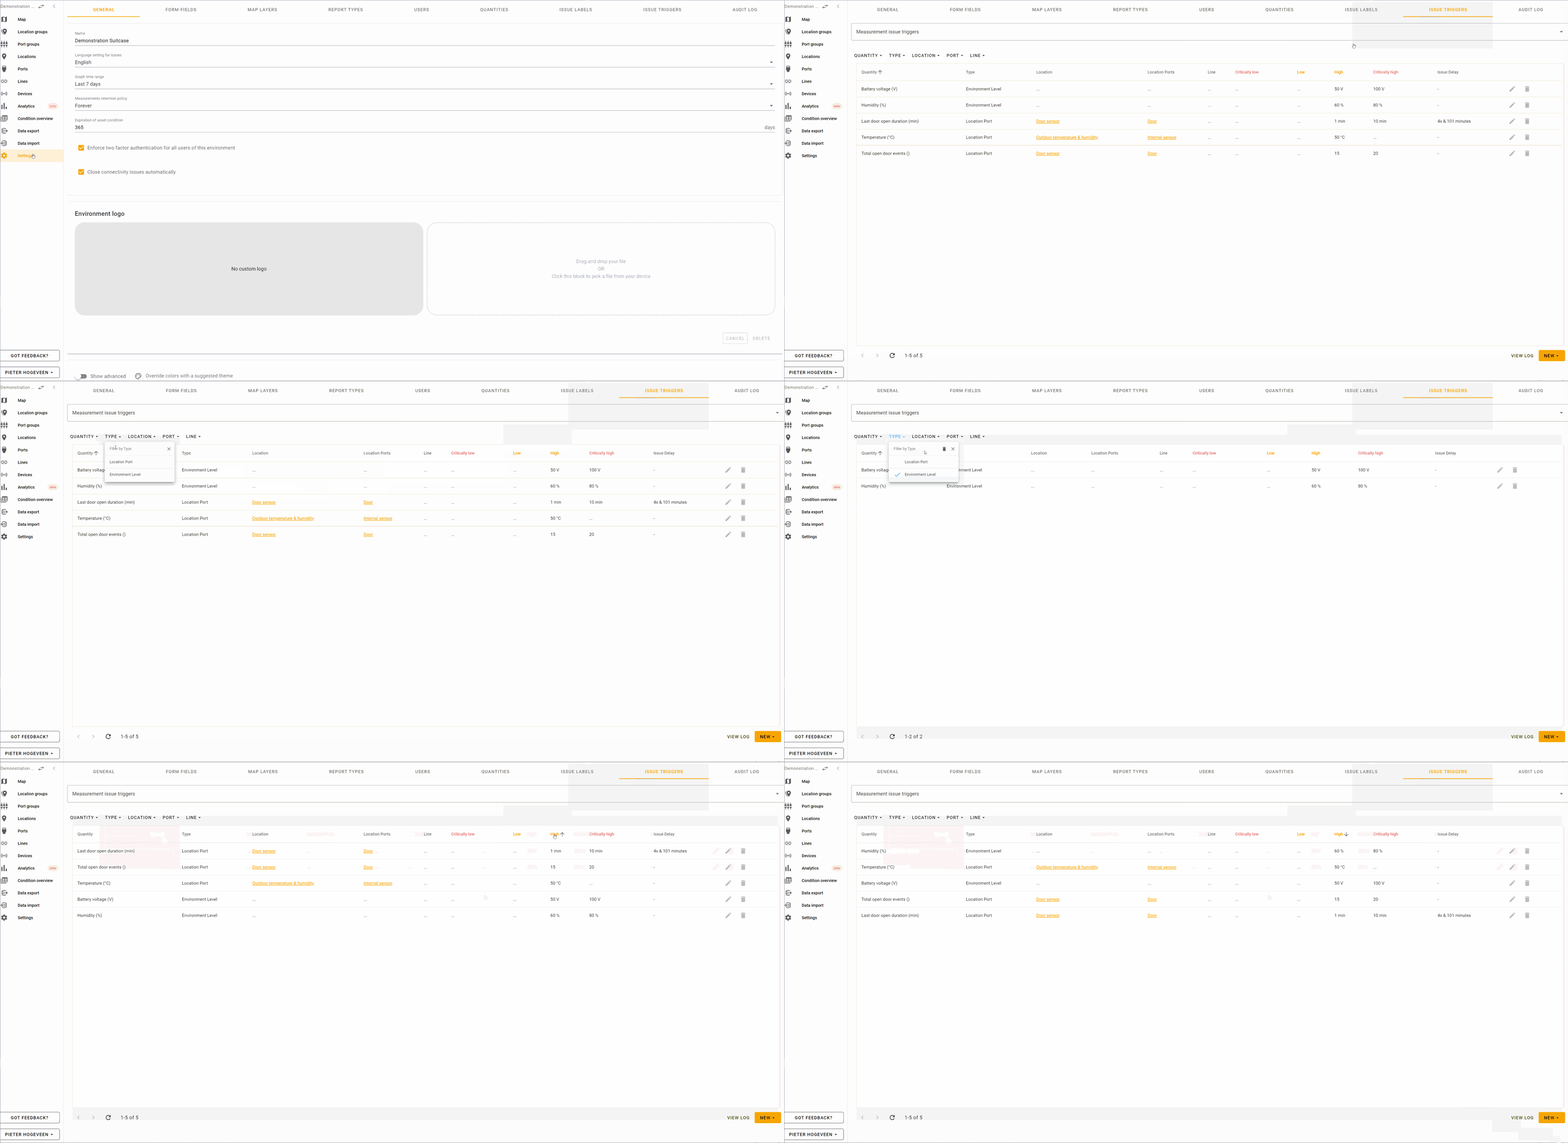
The filter option allows you to filter the issue triggers in the settings menu issue triggers tab by type. Using this you can only view Environment issue triggers or Location Port issue triggers.
You can sort issues on values for “Critically low”, “Low”, “High” and “Critically High”. Just click on the table header to sort on these values.
Issues dialog
Issue types
An issue has a type field, which depends on the way issue was created. Currently we have four issue types:

- Manual - issue created manually in AMP
- Connectivity - issue created by Connectivity issue trigger
- Measurement - issue created by Measurement issue trigger
- Internal channel - issue related to internal channel (e.g. battery level)
Measurement issue information
The respective threshold value is displayed in the dialogue for issues concerning measurements that exceed a threshold, allowing users to understand the extent of the issue.
Users can directly access the affected port and the linked line from this screen.
Additionally, this screen provides links to location and line graphs where the measurement is centered within a range equal to the environment’s default graph time range (which can be set in the monitoring environment’s settings). If the issue involves multiple measurements on the same port with different generation times, each offending measurement receives a personalized link to its respective graphs.

Commenting on issues
Once an issue is triggered an issue can be analysed and commented on. Anybody who is subscribed to the group that the location is part of will receive a notification. You can communicate with your colleagues on what happened and what needs to be done. On basis of this you can leave the issue open or close it. You can always re-open it later.
Add attachments
You can add files as attachments to issue comments.
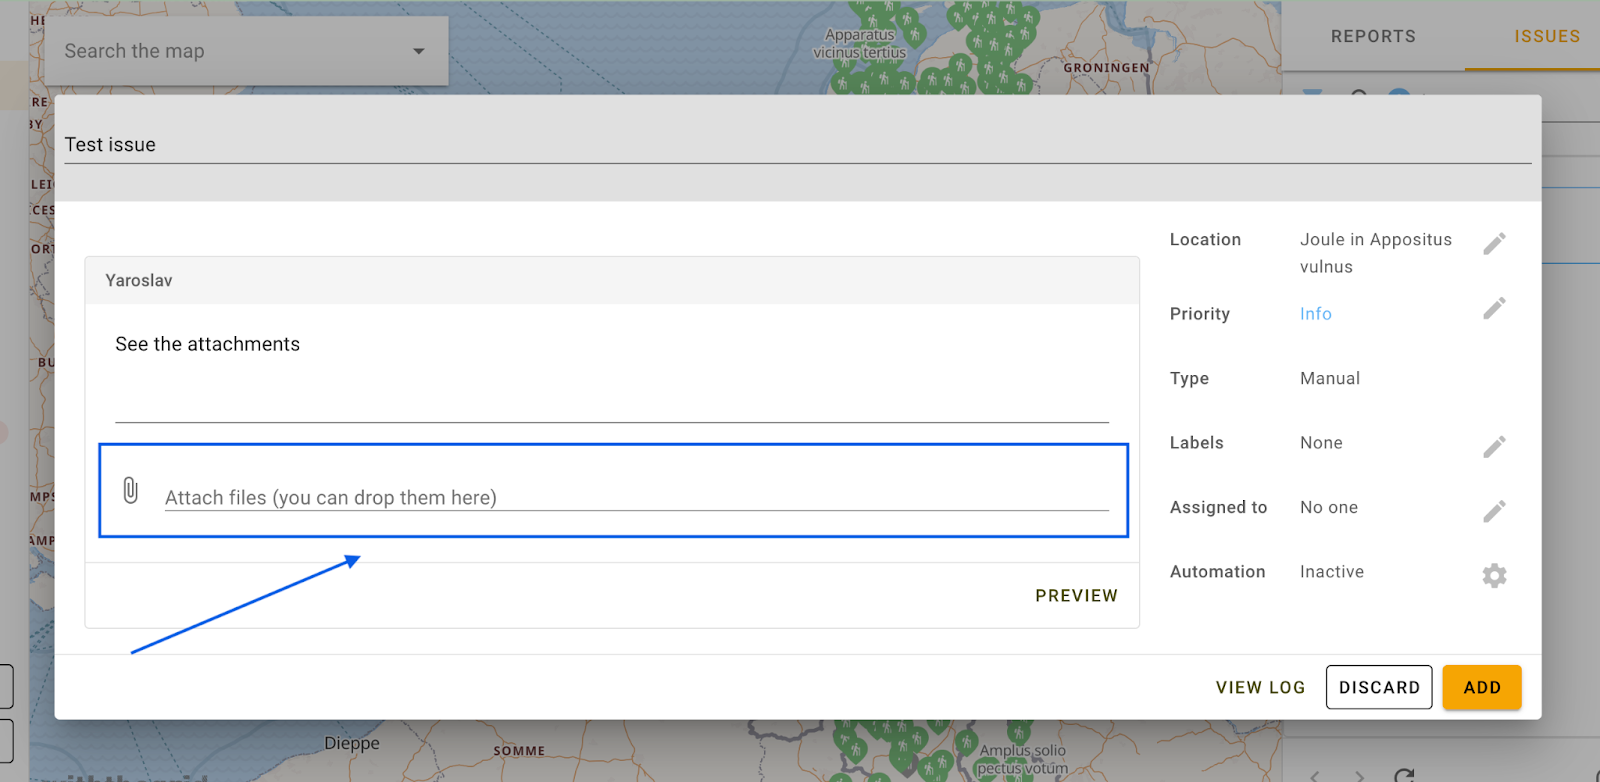
Clicking on the marked area will open file selection dialog. After submitting the files they can be downloaded by other users. If you will attach any images they will be shown inline after the text of comment instead of attachments bar.
Assign an issue to a user
Issues can be assigned to a specific user. You can also assign an issue to yourself.
Labels
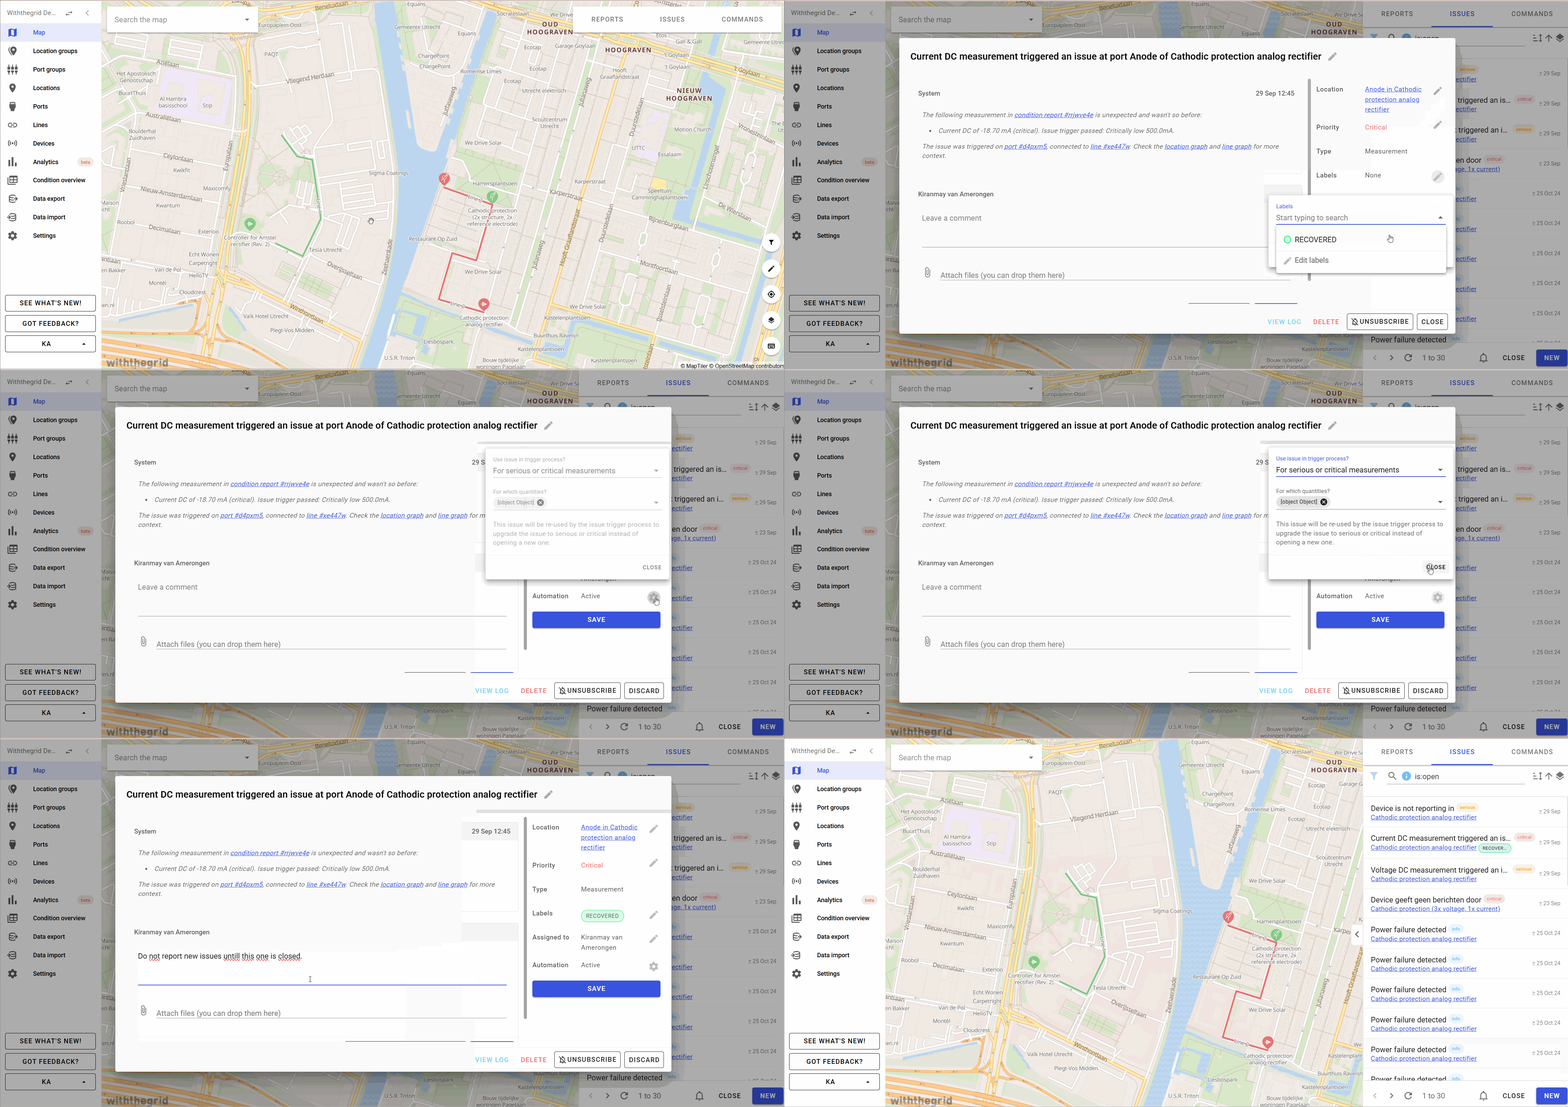
Users can create and assign labels to issues. An overview of labels can be found under settings where new labels can be added and managed. The map color of a location or line is still determined by the priority of the issue as noted in Setting issue triggers.
Automation
The Automation feature allows users to control the way new issues on a location are created. This helps reduce the amount of newly created issues. The Automation feature allows for 3 options: ‘No’, ‘For missing measurements’, and ‘For serious or critical measurements’ which are further explained below.
- ‘No’ automation option will not re-use the currently generated issue. This means, that every new issue-trigger, even if repetitive, will generate a newly created issue. This is not the default and will likely not be used often.
- ‘For missing measurements’ automation means that the triggering process will re-use the original issue. The priority of the issue (serious/critical) will be automatically updated instead of opening a new issue.
- ‘For serious or critical measurements’ automation allows users to re-use the issue for certain quantities. If quantities within the list pass the set issue-triggers, no new issues are generated. If a quantity that is not listed triggers an issue, the application will create a new one. The priority of the issue (serious/critical) will be automatically updated.
If you do not adjust the Automation, updates of issues will continue to be made automatically.
Alerts
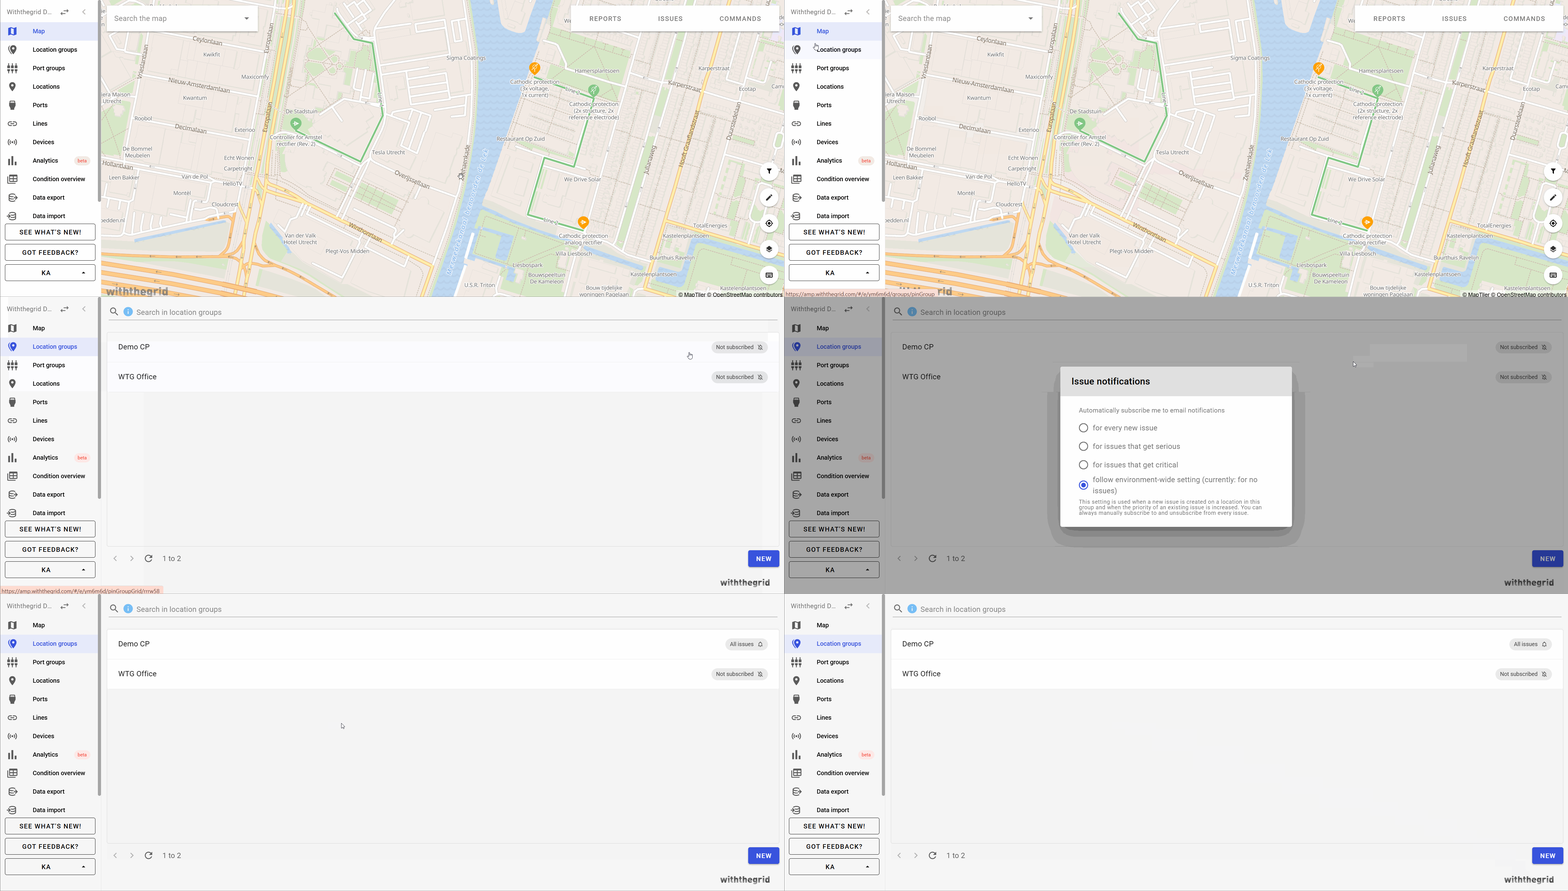
You can select to be notified of issues via e-mail in case you are subscribed to them. You can subscribe to issues on group level.
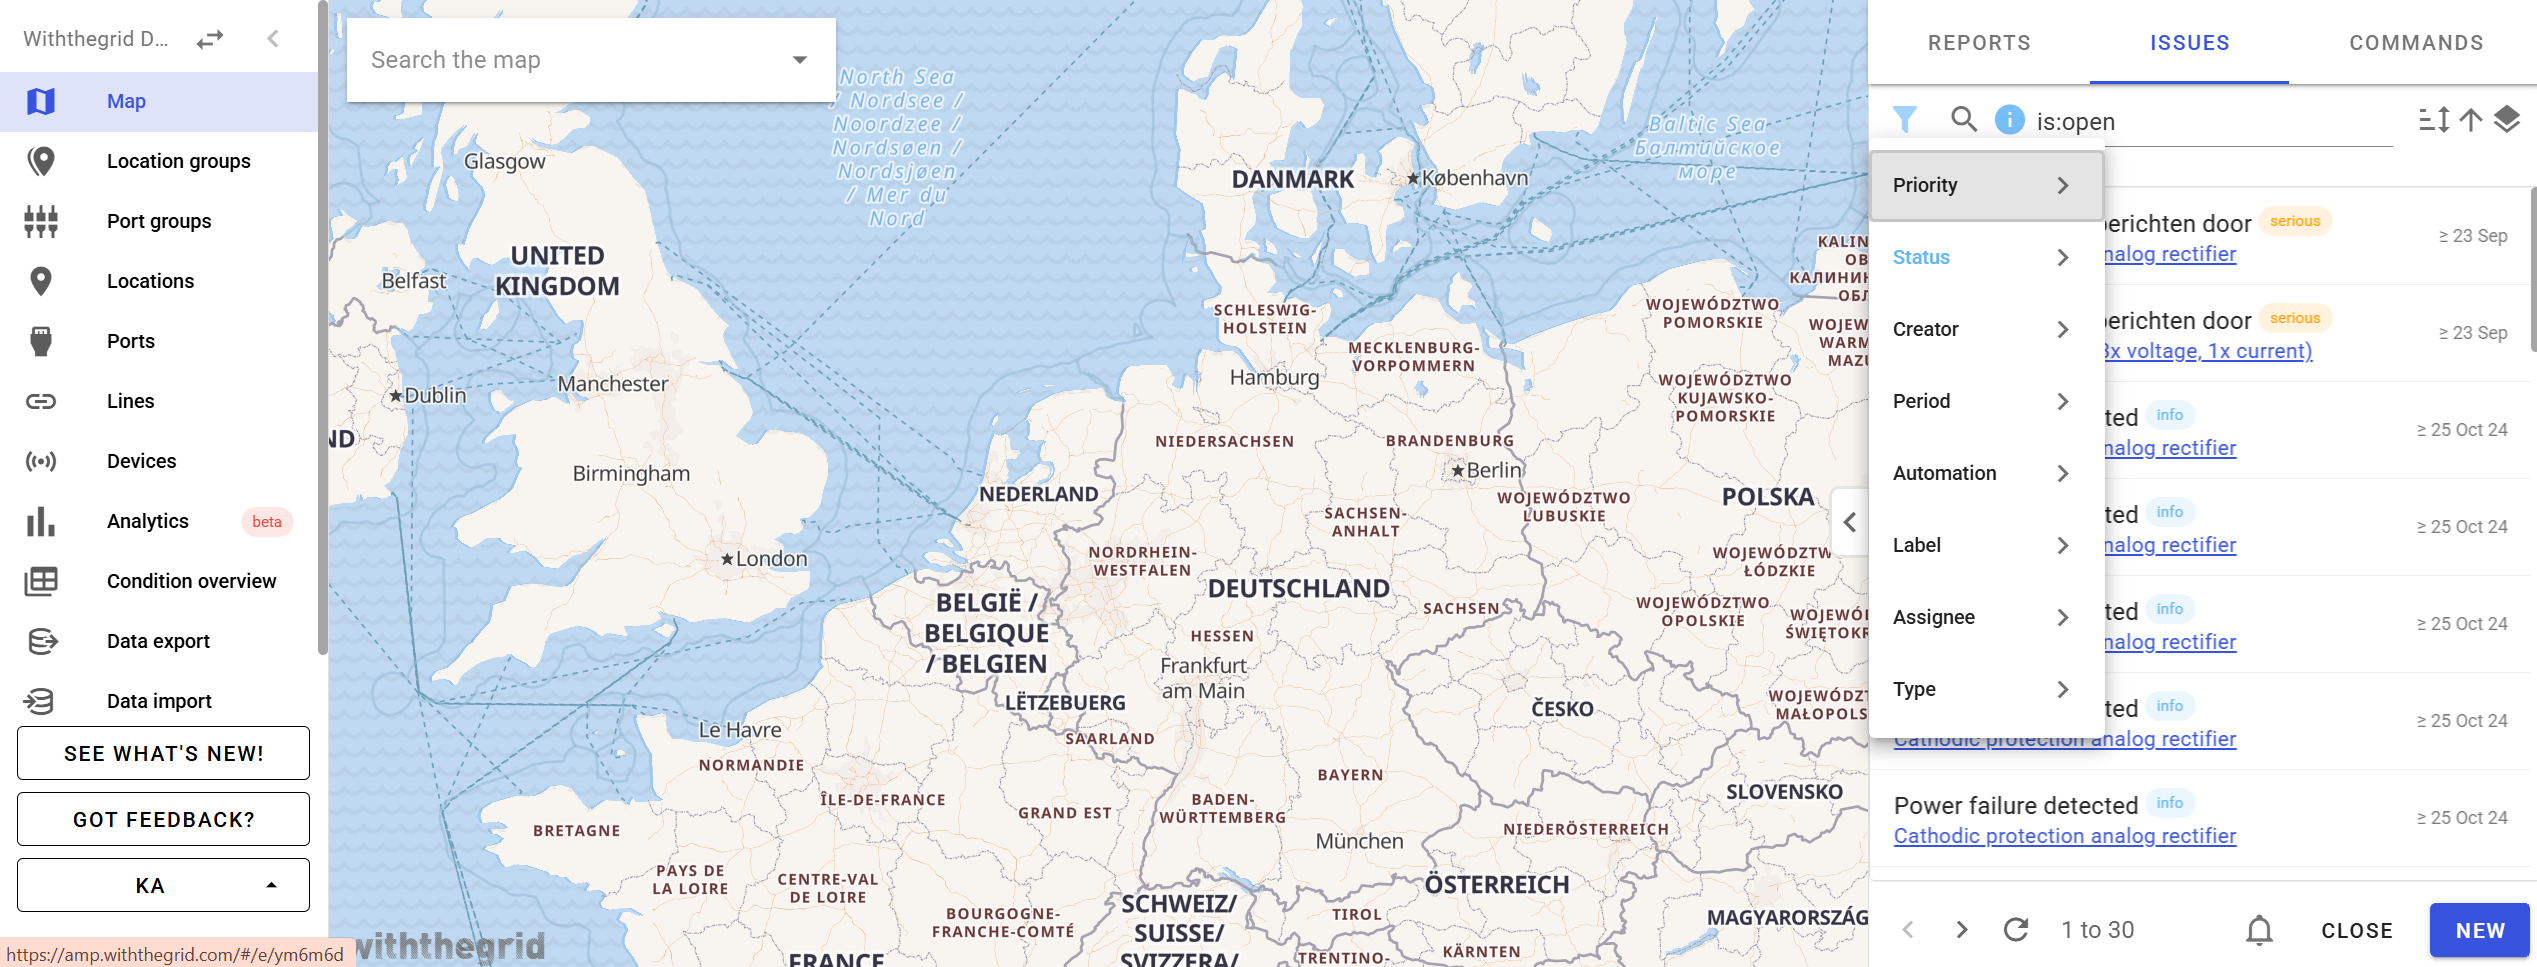
Search syntax
It is possible to search the issues with different constraints such as whether the issue was created manually or by a device, before a certain data, by a specific device etc.
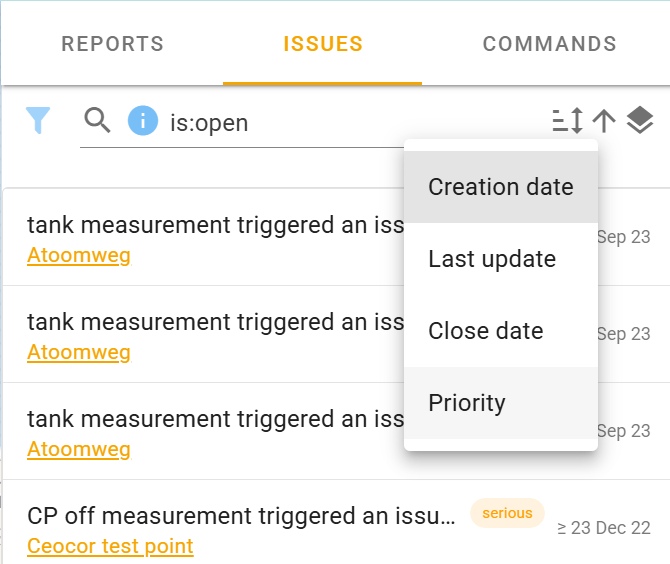
Sorting issues
Our current issue classification system uses three discrete severity levels (info: 0, serious: 1, critical: 2). However, this granularity is insufficient for effective issue prioritization, as users need to see issues with greater threshold violations before others of the same severity level.
Prioritizing issues
We’ve added “Priority”. A “severity_percentage” column that quantifies the degree to which an issue exceeds its defined threshold:
- For measurement-based issues: severity_percentage = ((measurement_value - threshold_value) / threshold_value) * 100
- For connectivity issues: severity_percentage = ((missed_reports - threshold_missed_reports) / threshold_missed_reports) * 100
This percentage is calculated when an issue is initially created but does not update automatically when subsequent measurements are recorded on the same port.
Note that;
- Manually created issues are assigned the maximum severity_percentage value
- Existing issues have been retroactively updated based on their opening comment to identify the original threshold values, and to avoid missing measurements
- Issues where severity cannot be calculated retain a default value of 0
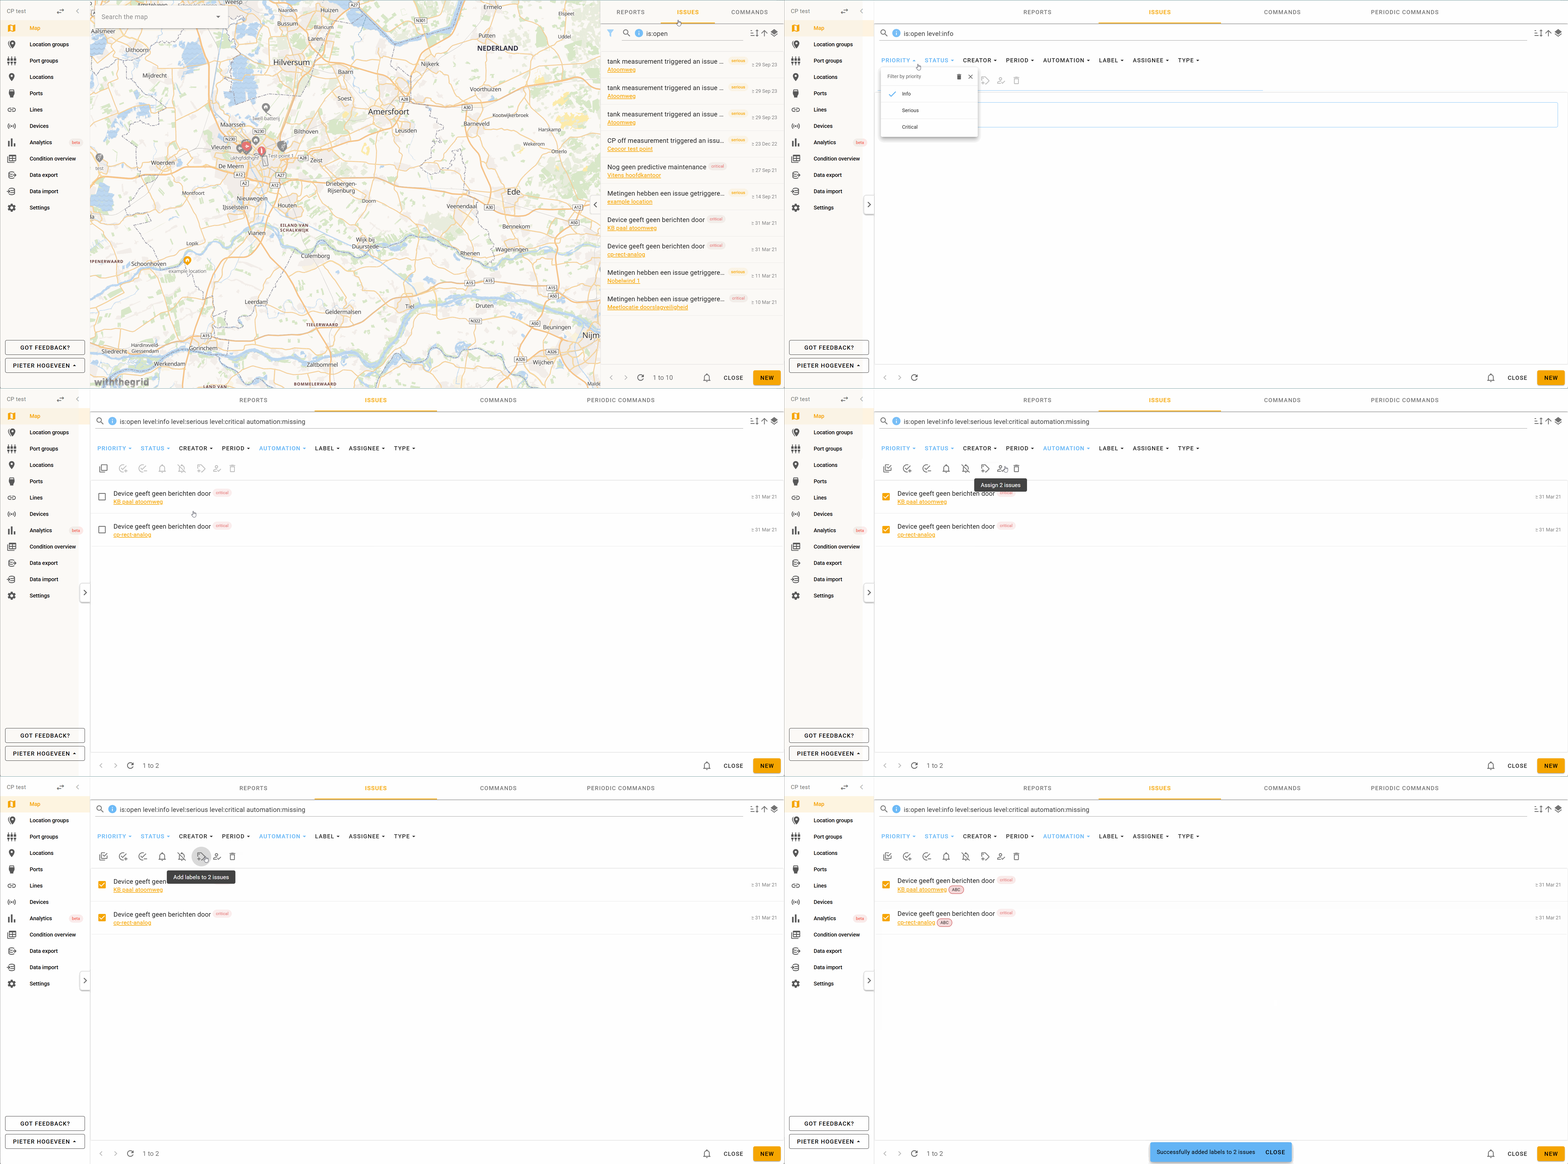
Bulk actions for editing issues
To manage your issues there is the possibility to edit them in bulk. Open the right side panel with the list of issues. Consequently, click the arrow in the middle and the panel will expand. At the top you’ll find the filter options you have to create a selection of issues. Once you have applied the filters, you can click the checkboxes to select the issues you want to perform a bulk action on. Or you could select all, ‘all’ meaning all the issues listed visibly in your screen.
Consequently, click one of the icons in the topbar to either;
- Mark as done
- Reopen issue
- Subscribe to issue
- Unsubscribe to issue
- Add label to issue
- Assign issue
- Delete issue
Subscribe to all issues
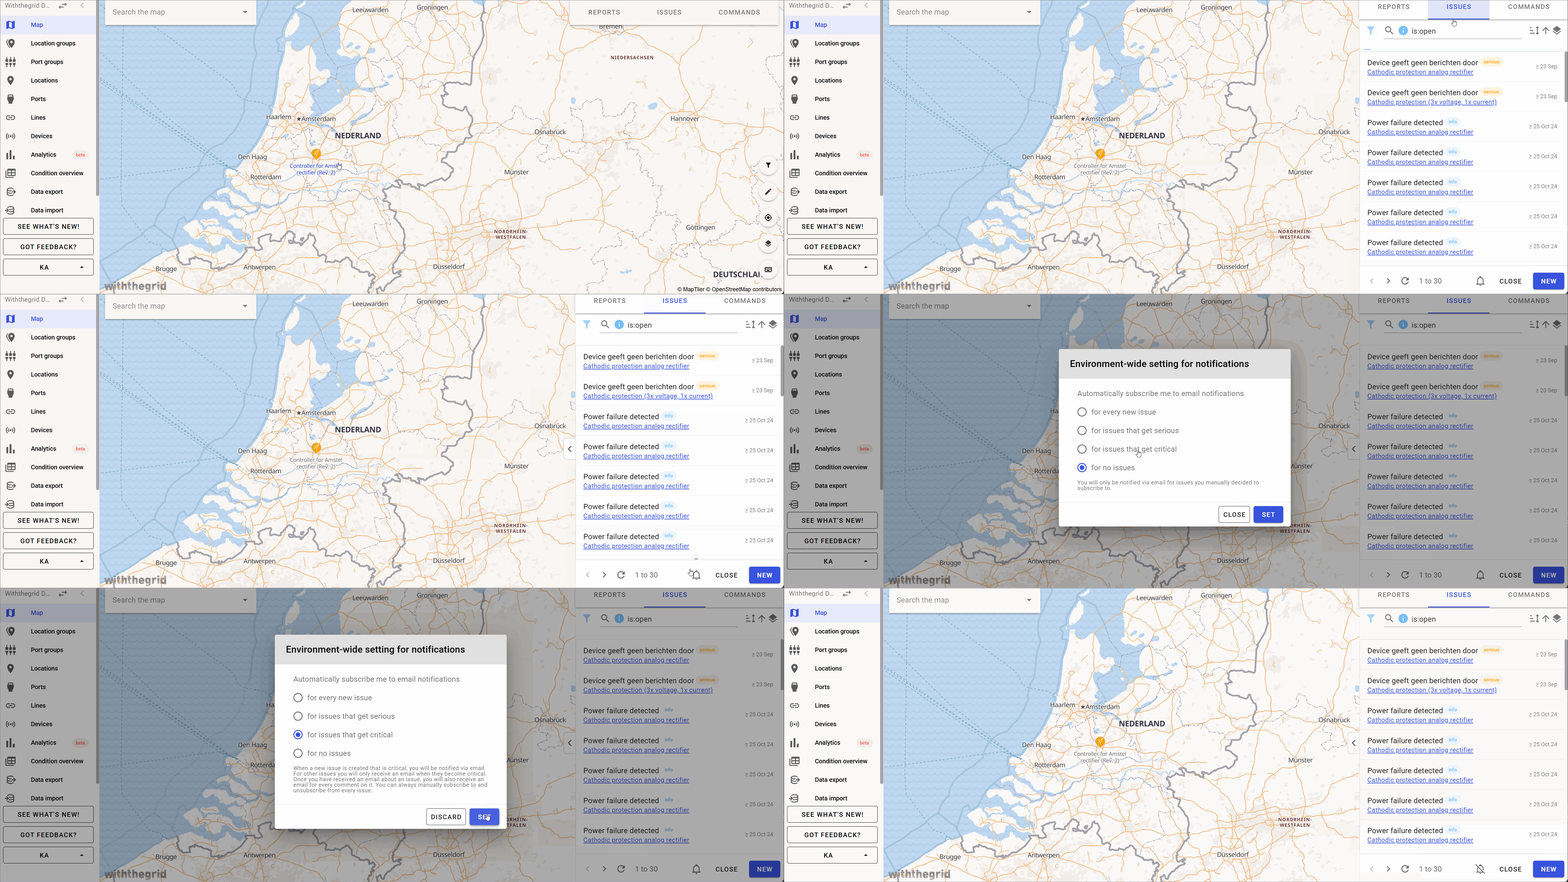
It is possible to subscribe to all issues in an environment. With every new issue, or only with issues of a certain priority, you will receive an email. Go to issues and click ‘subscribe’:
Issues for missed reports
A critical (red) issue is now generated when the platform has not received 13 or more measurement reports from a sensor and the sensor has not come online for at least 30 minutes. A serious (orange) issue is generated when the platform has not received 2 or more measurement reports from a sensor and has not been online for 3 days or more. Lear more about issue triggers and alerts here or watch a short video!
How-to video
Watch the video on Youtube