

Location groups
Locations can be combined to form a group. A location can be part of multiple groups at the same time.
Creating a group
Section titled “Creating a group”You can create a new group by going to the left-hand side panel and clicking on groups.
The list of and the link to all created locations can be accessed by selecting the locations icon on the left-hand side menu bar.
Ordering a group
Section titled “Ordering a group”The order of locations in groups can be modified. In this way you can use it as a list to for example manual measurements. You can optimize your route by clicking on the magic wand. This will minimize the distance between the locations according to the travelling salesman algorithm – supercool!
Showing locations of selected group
Section titled “Showing locations of selected group”It is possible to only show the locations of a selected group. This makes it easier to see the locations you are working on when having a group selected. This feature is optional and can be disabled/enabled on the map as shown below.
Move groups to a different map layer
Section titled “Move groups to a different map layer”You can easily move a group of locations to a map layer. You can also change them from one map layer to another. With one click, you can also take along lines which are connected to the locations that you are moving.
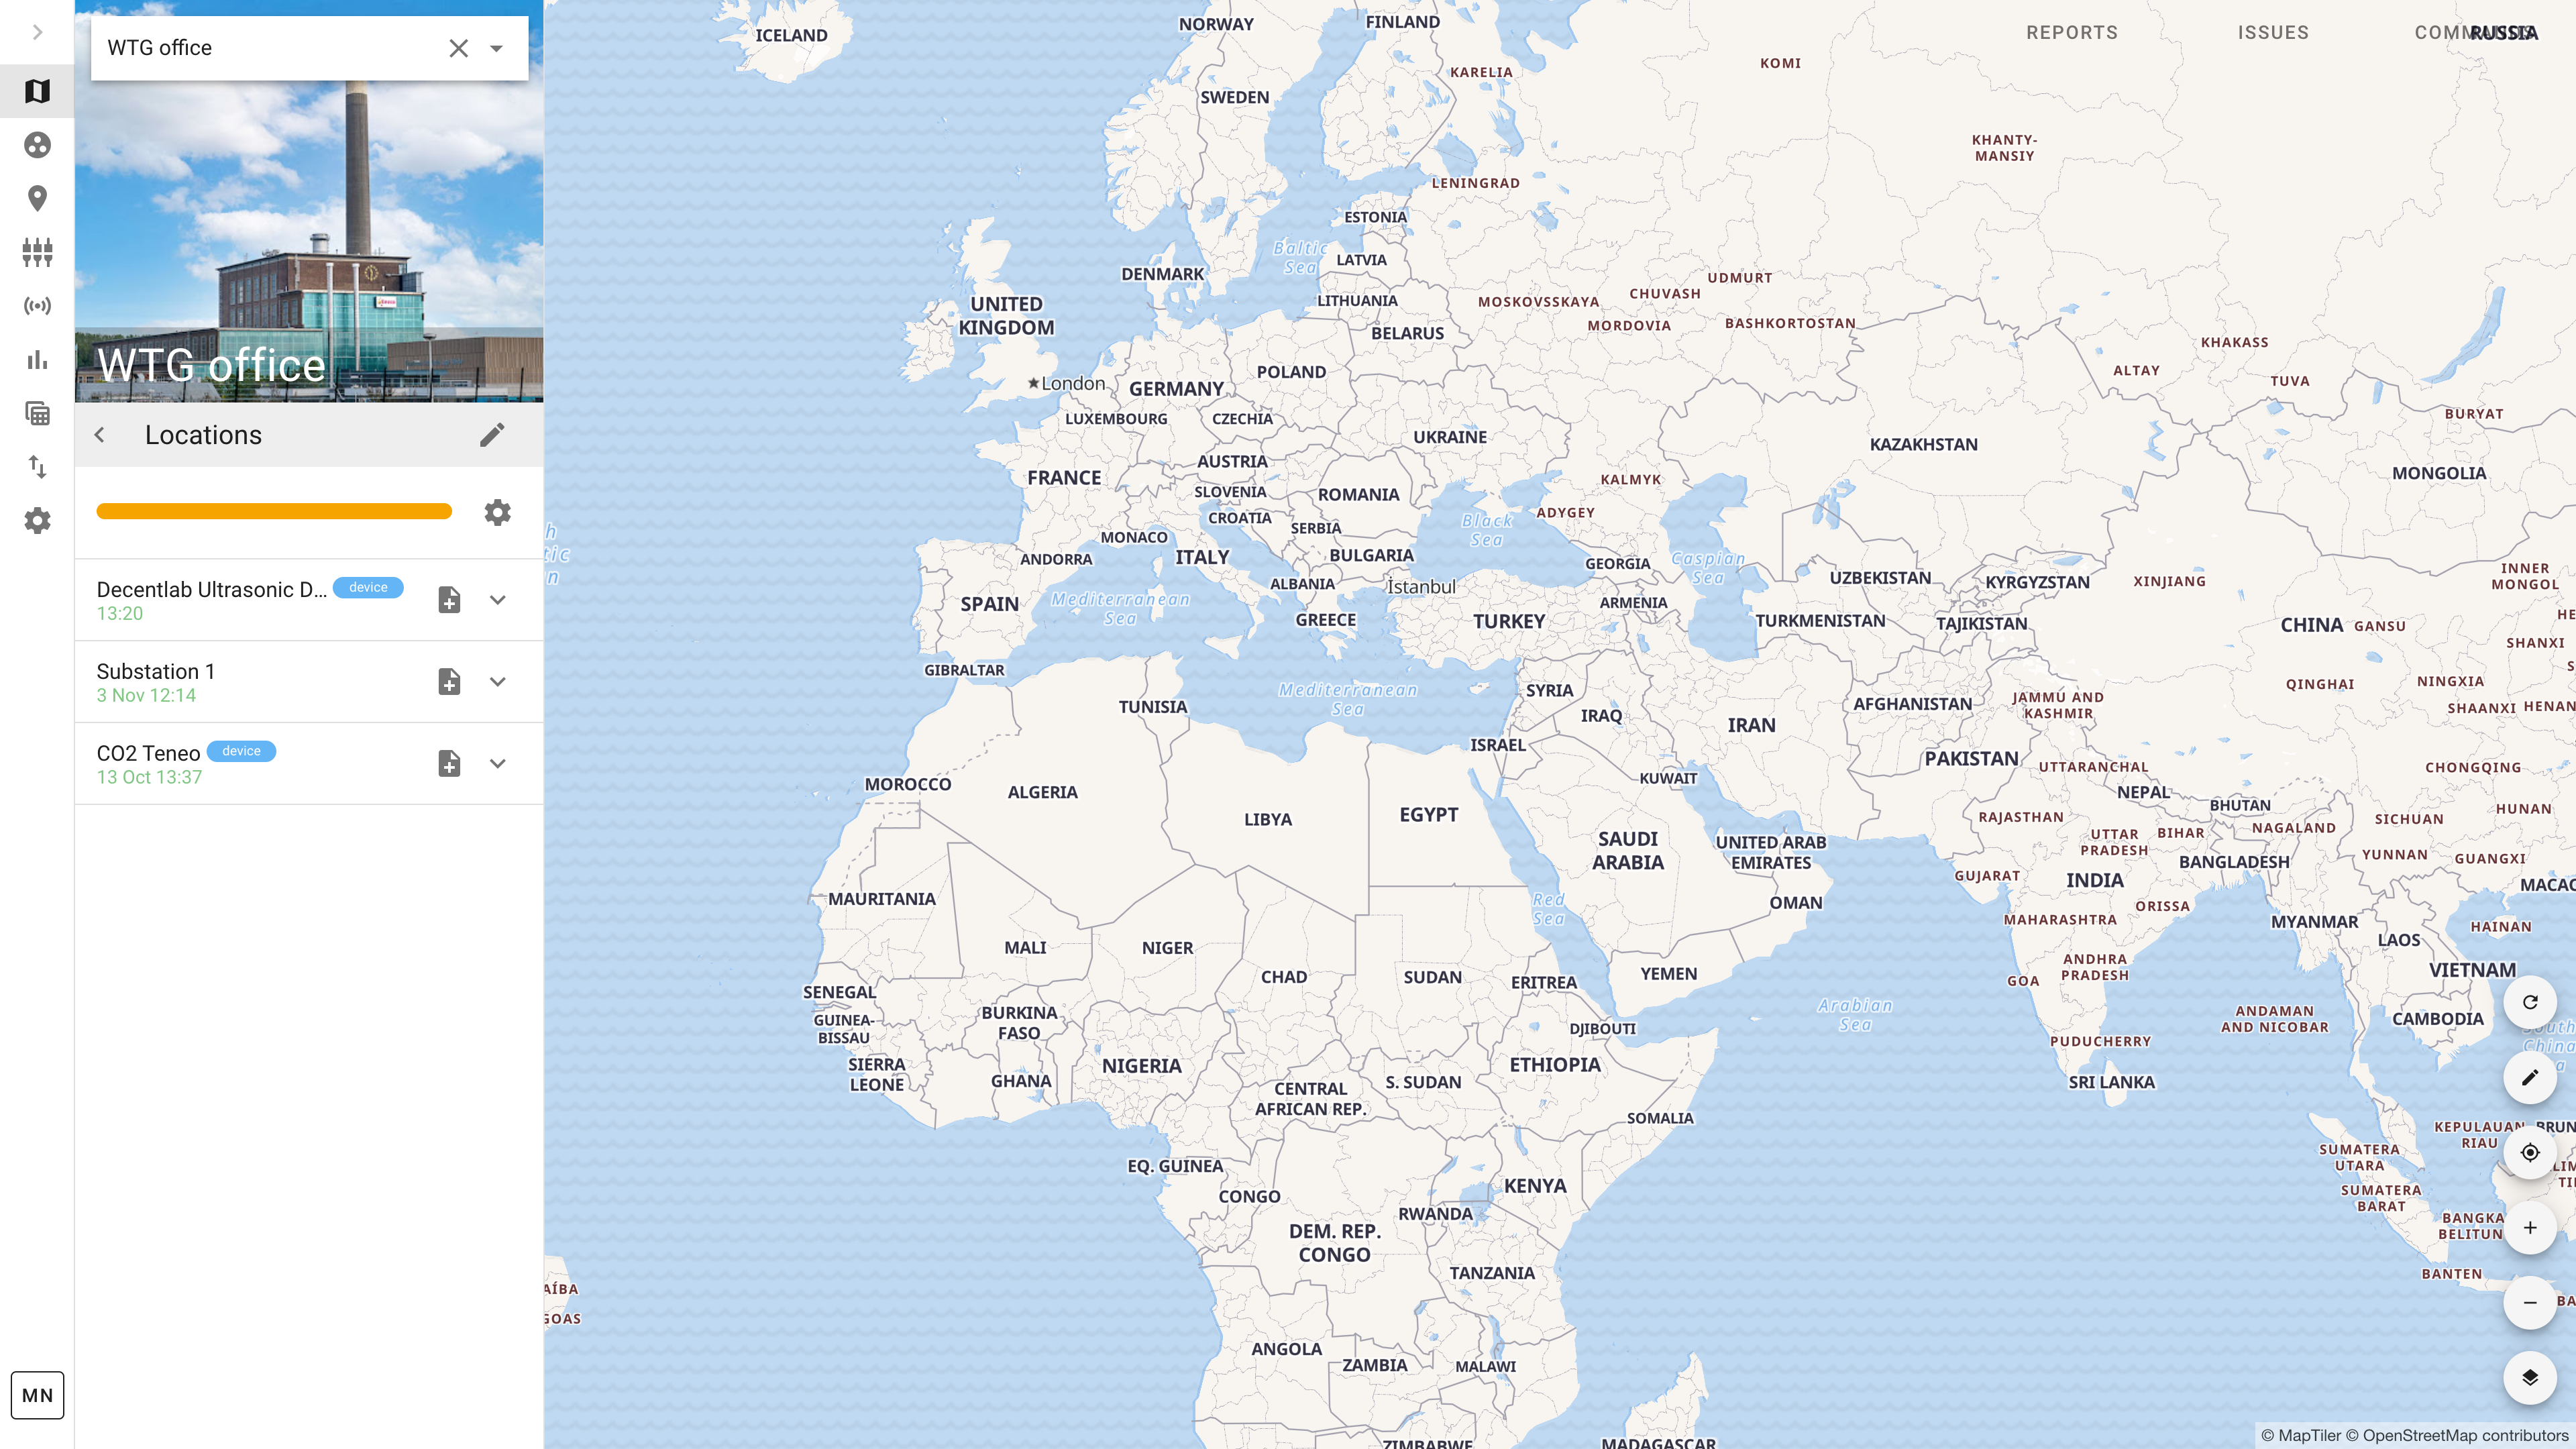
Last measurement dates
Section titled “Last measurement dates”The overview of locations also shows the last measurement date. Based on the group configuration the last measurement date will be either green or yellow. This range during which last measurement dates are considered can be configured with the gear setting icon. This will specify the date from which a measurements is either green or yellow, e.g. green is measured in last month.
Sign up to issues
Section titled “Sign up to issues”At group level it is possible to receive notifications of any issue that is generated in the group. See the alerts section for an explanation on this.
Using groups for visualization
Section titled “Using groups for visualization”You can visualize data at the group level and define custom graph layout. Check out our YouTube video for a quick tutorial on how you can leverage groups to get a better overview of group data.
Watch the video on Youtube