Condition reports
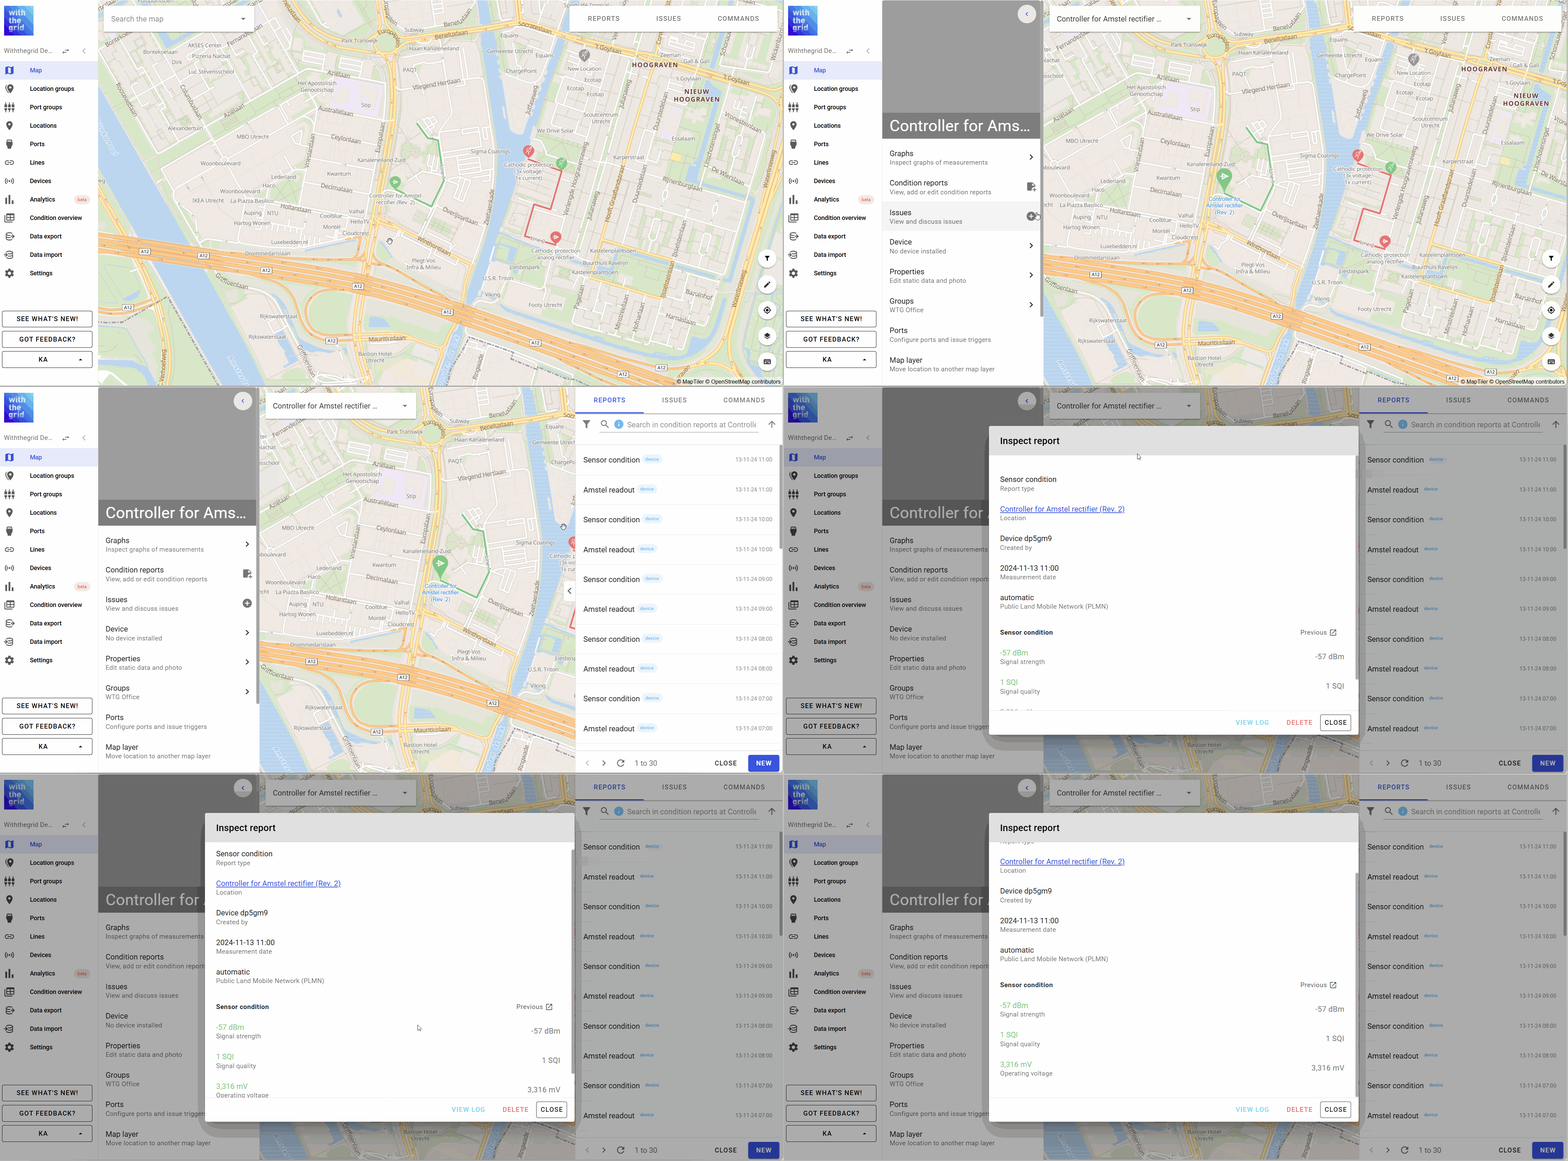
Condition reports are the reports where measurement data that is stored generated from devices or other data sources. Condition reports can also contain form field data such as remarks, drop down menu’s, photos, attachments etc.
Condition reports also contain the previous measurement value. This is useful when a condition report is filled manually in the field and a comparison needs to be made whether the values are correct.
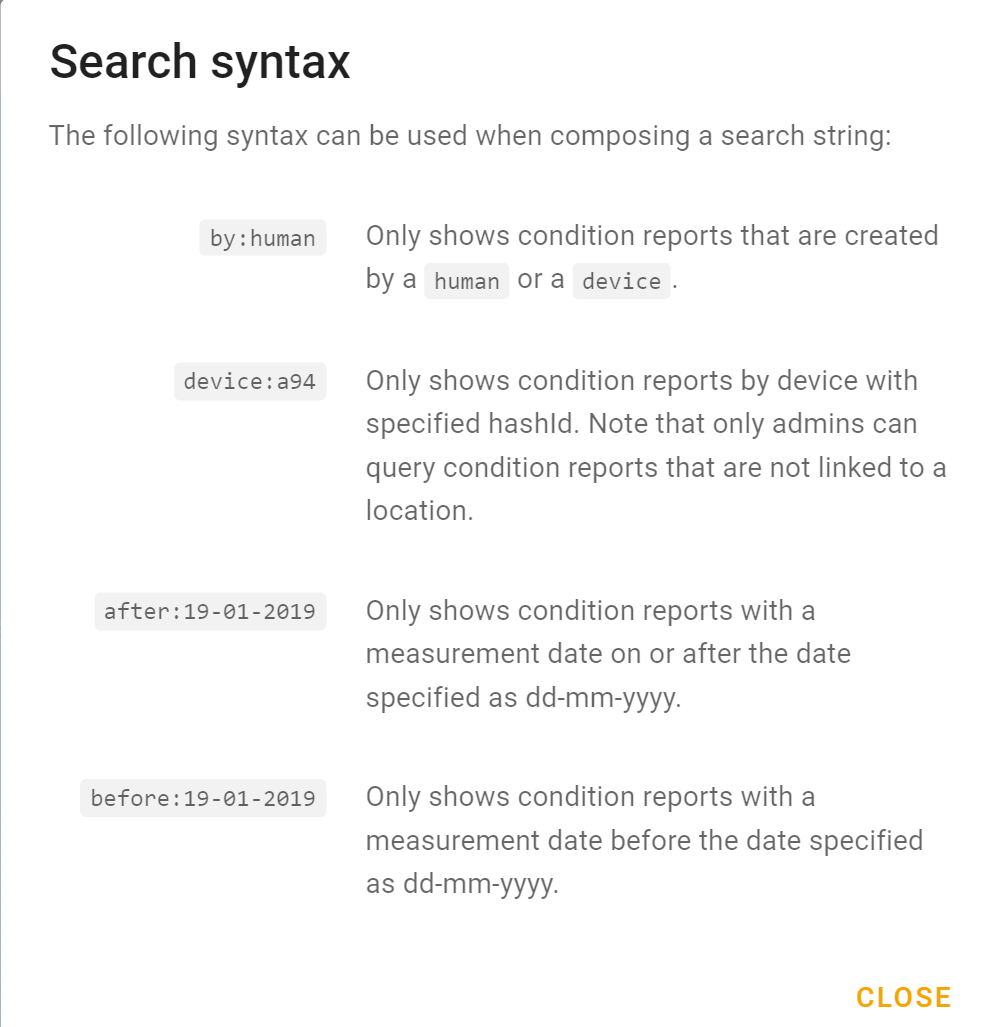
It is possible to search the condition reports with different constraints such as whether the condition report was created manually or by a device, before a certain data, by a specific device etc.
Designing a condition report
It is possible to design your own condition report containing specific quantities and specific form fields. Go to environment settings and report types.
Condition report overview
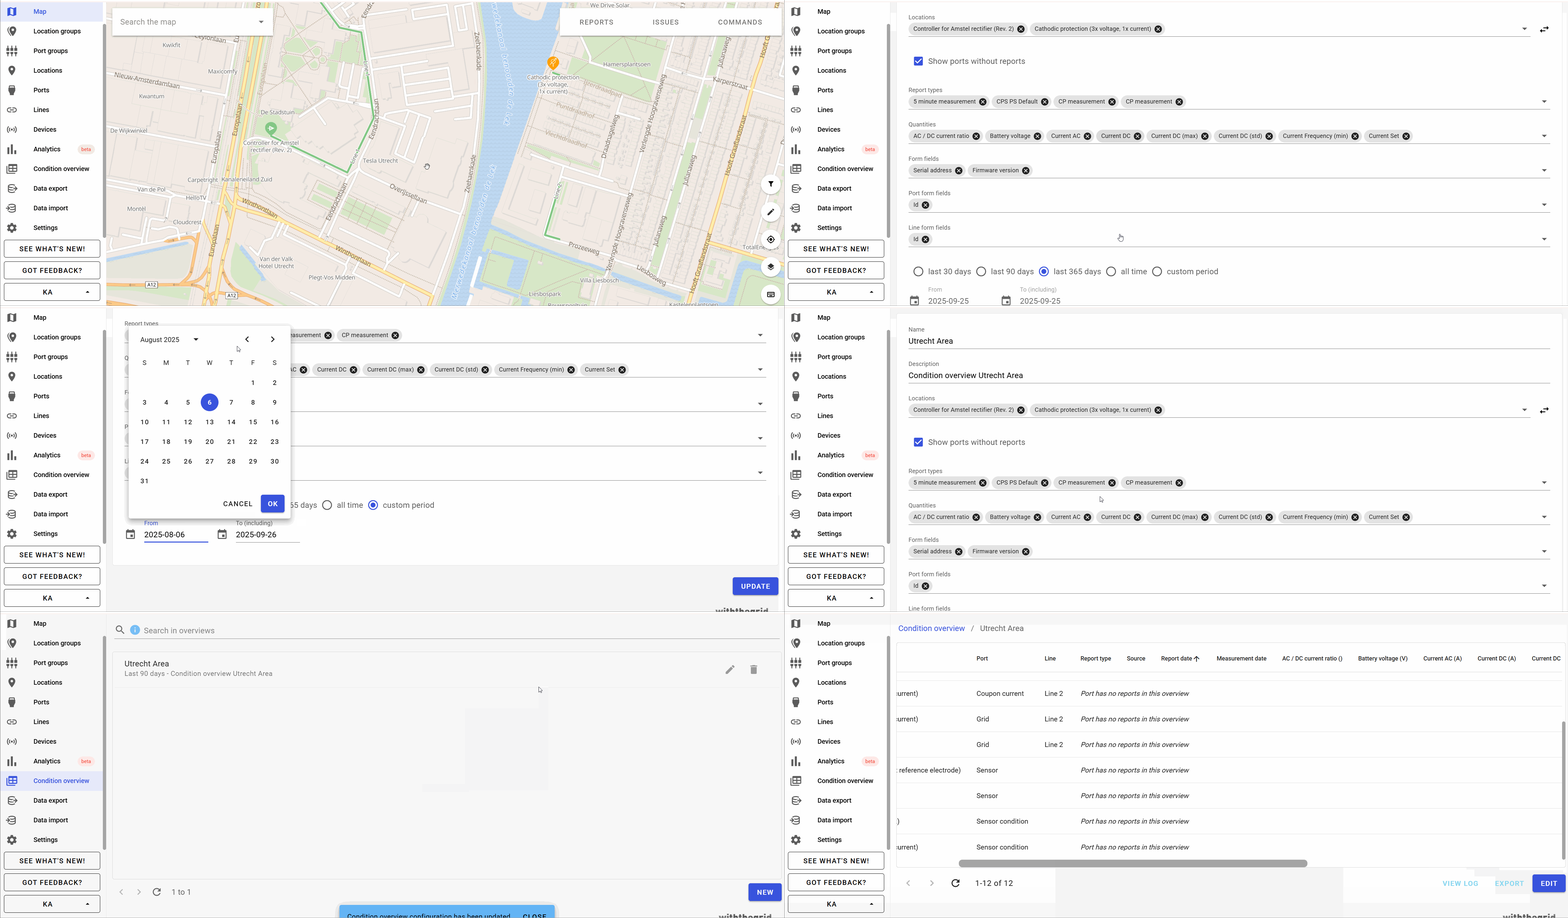
The condition report overview allows you to view and create custom tables of measurement data. This is useful for getting an overview or for evaluating inspections that have been carried out. All designed tables can be viewed by all users in the environment.
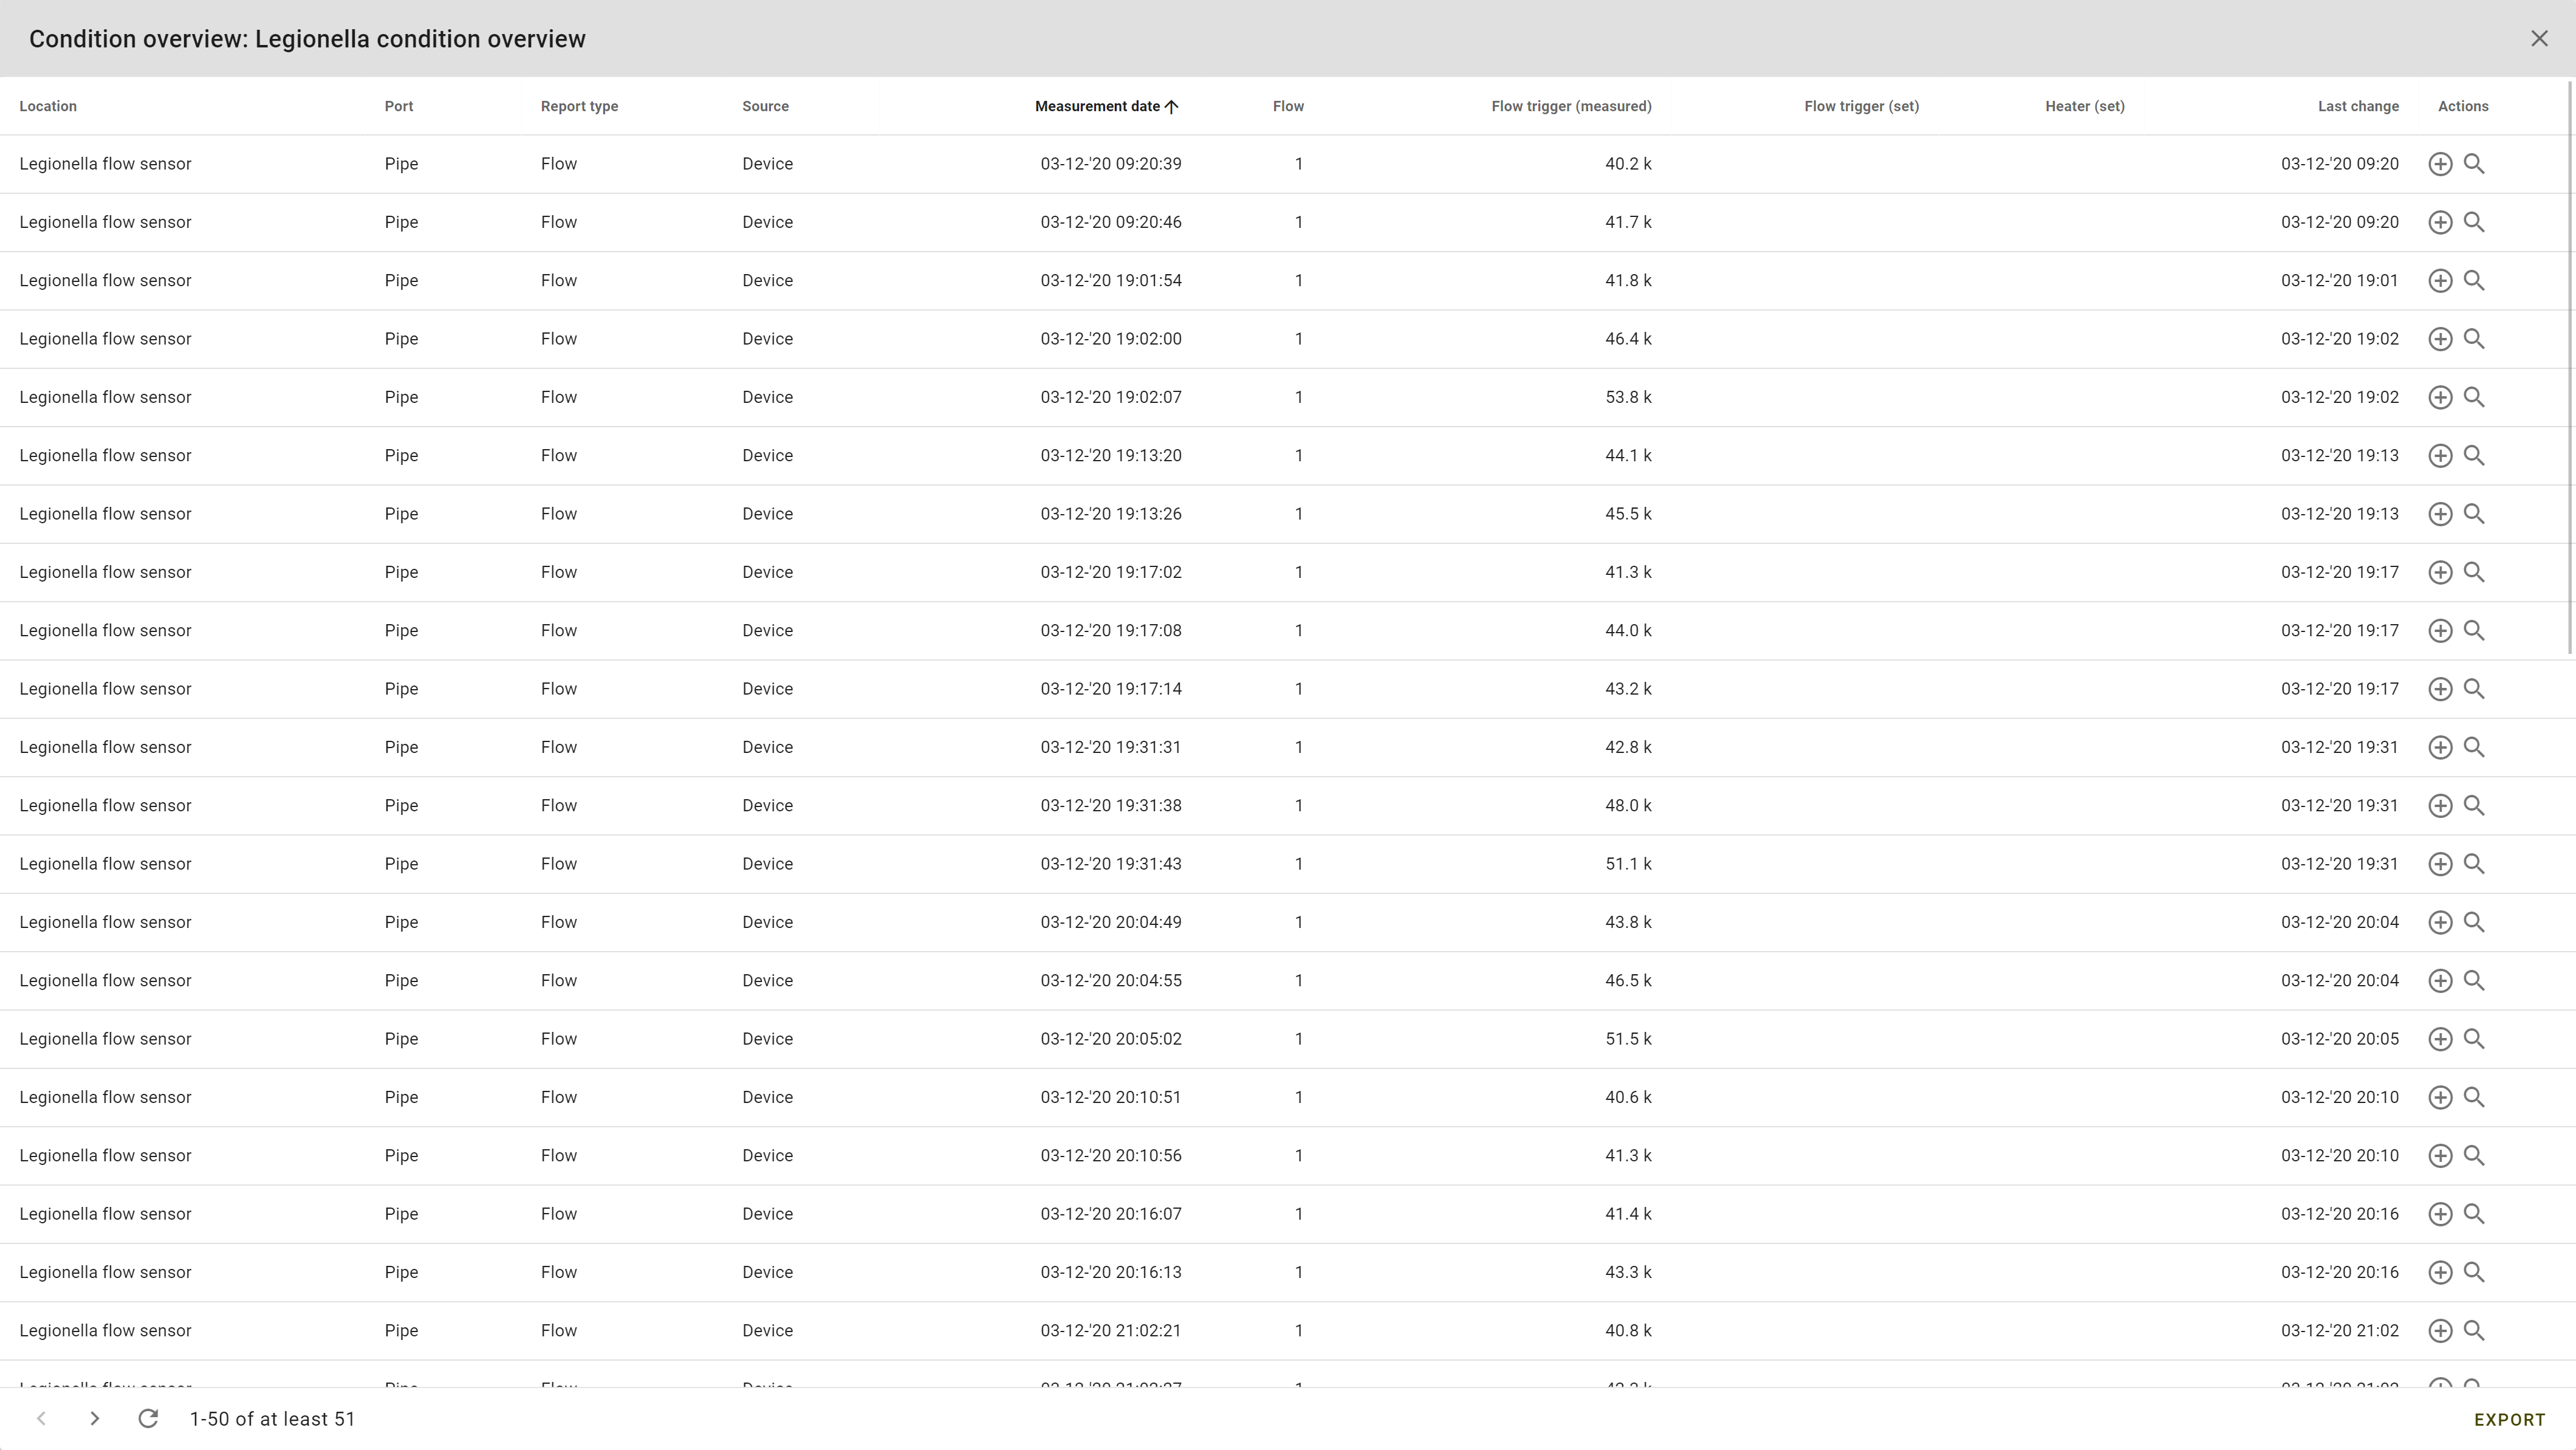
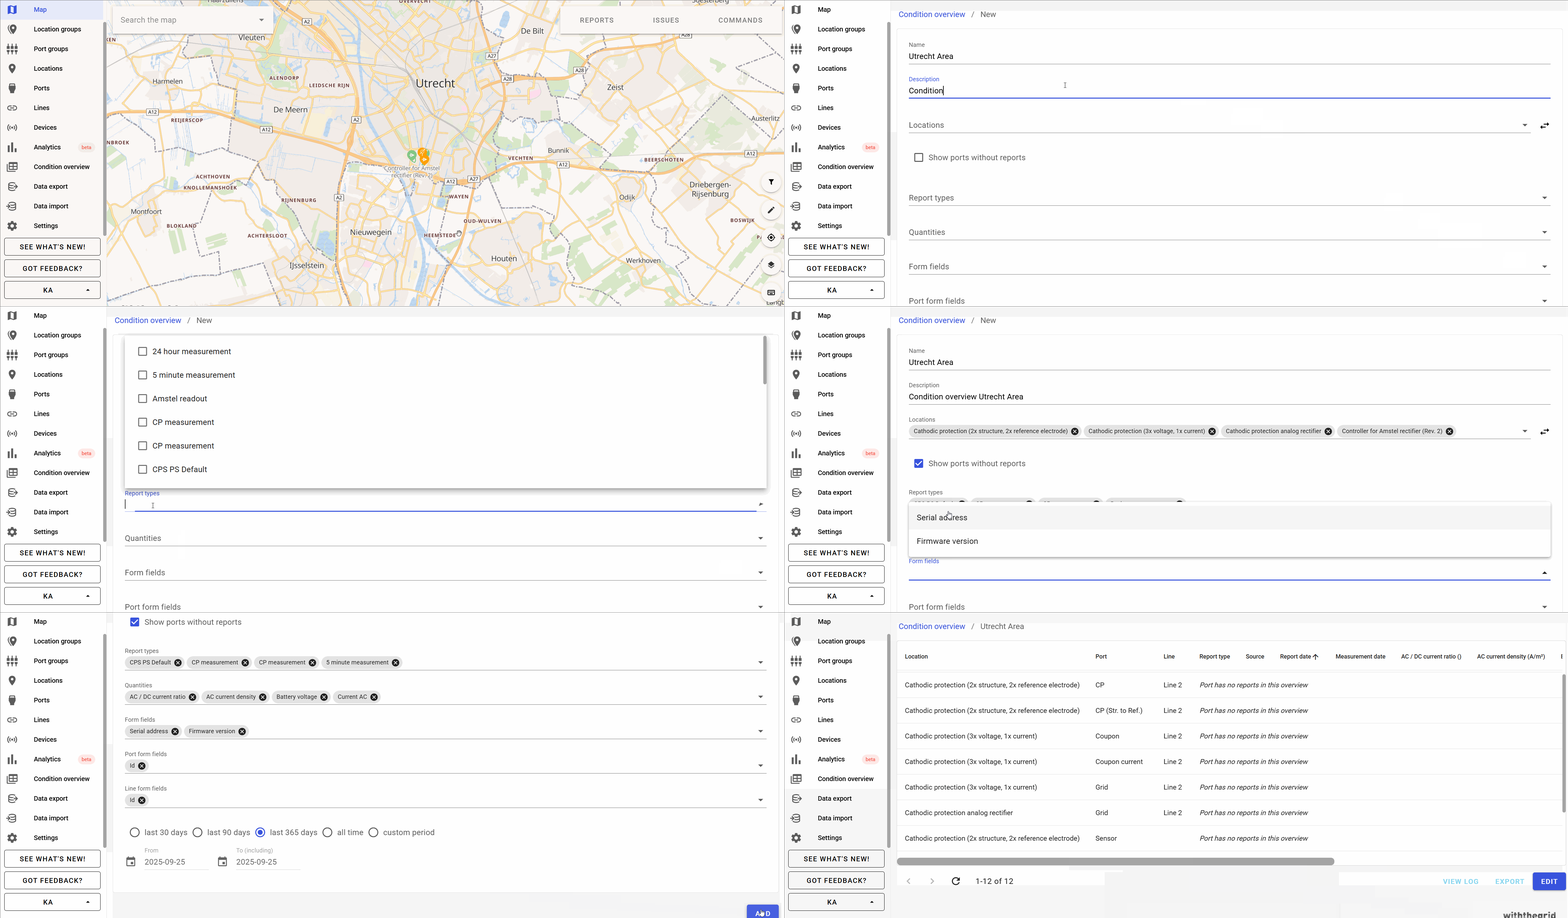
Creating a new condition report overview
You can design your own custom table by selecting the parameters. You can choose which group, locations and condition report types you want as well as specific quantities and form fields. Also you can select a static period for example: 1-1-2020 until 31-1-2020 or a dynamic period such as: last quarter.
