

Dashboard
Dashboard
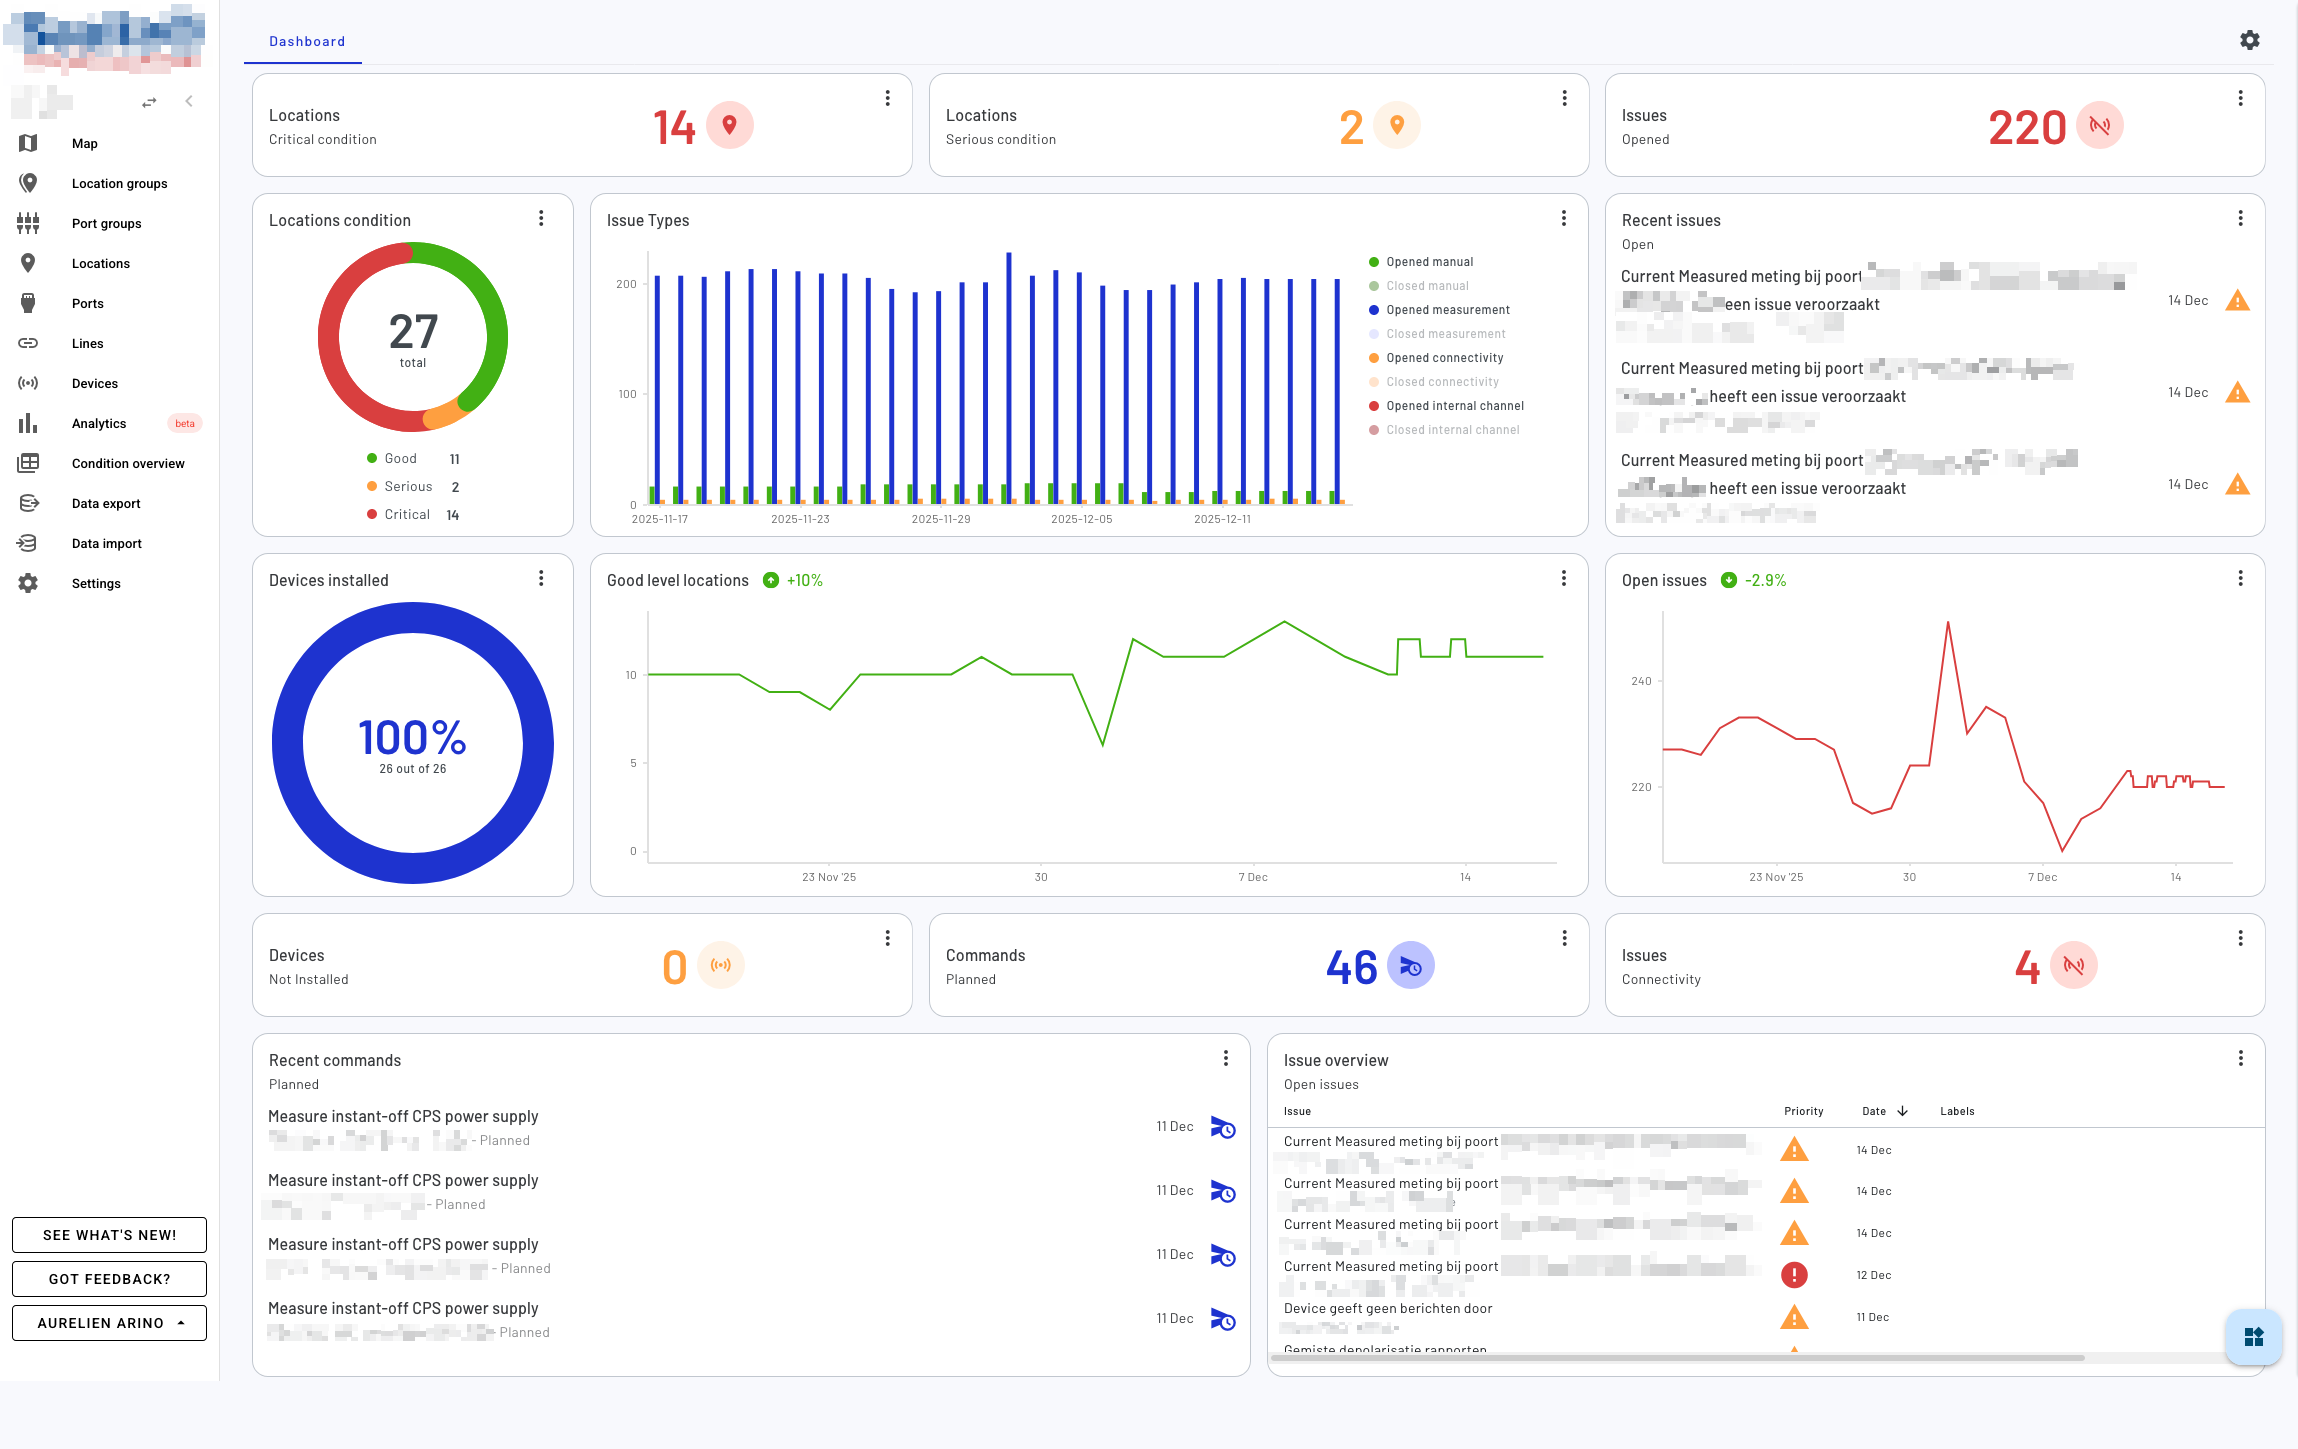
The Dashboard provides a customizable, grid-based overview of your monitoring environment. It allows you to create a personalized view by adding, arranging, and configuring various widgets that display real-time data about your devices, issues, locations, and commands.
Overview
The dashboard uses a flexible grid layout where you can add multiple widgets to monitor different aspects of your system. Each widget can be moved, resized, and customized to suit your monitoring needs.
Working with Widgets
Adding Widgets
Widgets can be added to your dashboard through the widget drawer. Each widget type displays specific information about your monitoring environment:
- Counters: Display numerical statistics for devices, issues, locations, or commands
- Charts: Visualize data trends and distributions using donut charts, bar charts, or line charts
- Lists: Show recent items such as recent issues or commands
- Tables: Display detailed tabular data with filtering options
- Trend Indicators: Show trend analysis for various metrics over time
Moving Widgets
In edit mode, you can rearrange widgets by dragging and dropping them to different positions on the grid. The dashboard automatically adjusts the layout to accommodate the new arrangement.
Resizing Widgets
Widgets can be resized by dragging their edges or corners. Each widget type has minimum and maximum dimensions to ensure optimal display of its content. Some widgets support different aspect ratios:
- Counter widgets: Can be displayed in wide (row) or square (column) formats
- Chart widgets: Require larger minimum sizes to properly display visualizations
- List and table widgets: Can be expanded vertically to show more items
Configuring Widget Settings
Many widgets include configurable settings that allow you to customize what data they display and how it’s presented. To access widget settings, click the menu button on a widget and select “Edit widget”. Available settings vary by widget type and may include:
- Filters: Configure which data to display (e.g., issue types, severity levels, command states)
- Data limits: Set the number of items to display in lists and tables

Removing Widgets
To remove a widget from your dashboard, click the menu button on the widget and select “Delete widget”. You’ll be asked to confirm the deletion.
Widget Types and Resources
Device Widgets
Monitor the status and trends of devices in your environment:
- Device Counter: Shows counts of installed, not installed, or total devices
- Device Donut Chart: Visualizes the distribution of device installation status
- Device Line Chart: Displays historical trends of device installation over time
Issue Widgets
Track and analyze issues across your monitoring environment:
- Issue Counter: Displays counts of open, closed, or total issues, with filtering by issue type (manual, measurement, connectivity, internal channel)
- Issue Bar Chart: Shows distribution of issues by type
- Issue Line Chart: Tracks historical trends of open and closed issues
- Recent Issues List: Shows a list of recent issues with configurable filters
- Issues Table: Provides a detailed table view with advanced filtering by labels and priorities
Location (Pin Group) Widgets
Monitor the health status of locations in your environment:
- Location Counter: Shows counts of locations by level (good, serious, critical)
- Location Donut Chart: Visualizes the distribution of location levels
- Location Line Chart: Displays historical trends of location levels over time
Command Widgets
Track command execution and status:
- Command Counter: Shows counts of commands by state (planned, missed, late, deleted, completed)
- Recent Commands List: Displays a list of recent commands with configurable filters
Trend Indicators
Analyze trends across different metrics to identify patterns and changes over time. Trend indicators can be configured for devices, issues, or locations with customizable time windows.
Edit Mode
The dashboard has two modes:
- View Mode (default): Widgets are locked in place and display live data. You can still interact with widget settings individually by clicking the menu on each widget.
- Edit Mode: Enables full dashboard customization where you can add new widgets, rearrange existing ones, resize them, and remove unwanted widgets. Enter edit mode by clicking the “Arrange dashboard” button.
When in edit mode:
- Widgets can be dragged to new positions
- Widget sizes can be adjusted using drag handles
- New widgets can be added from the widget drawer
- Press Escape or click “Save dashboard” to exit edit mode
Saving Your Dashboard
Your dashboard layout and widget configurations are automatically saved when you:
- Exit edit mode
- Remove a widget (when not in global edit mode)
- Click the “Save dashboard” button
- The dashboard is saved in the cloud for an environment, changes you make to the dashboard will be saved for all users of that environment, across devices